
Programs / HiMCM / Worked demo paper
Tackling the Drought — Forecasting Lake Mead & Sizing Water Recycling
A complete 22-page modeling paper, produced end to end at the award-winning standard: a coupled pipeline from reservoir level to storage to budget to recycling, validated against real U.S. Bureau of Reclamation data, with a Monte-Carlo coverage analysis and a named decision flip under stress. This is the deliverable the seven-stage coaching method is built to reach.
The Paper
22 pages · read it in placeDeterministic compliance — all pass
| Page count | PASS | 22 pp (≤ 25) |
| Summary length | PASS | 427 words (band 340–560) |
| Summary numeric | PASS | 27 results stated |
| Anonymity | PASS | control number only |
| References | PASS | present, in-text cited |
| AI-Use report | PASS | present |
| Figures | PASS | 17 (target ~14) |
Headline results — real data, validated
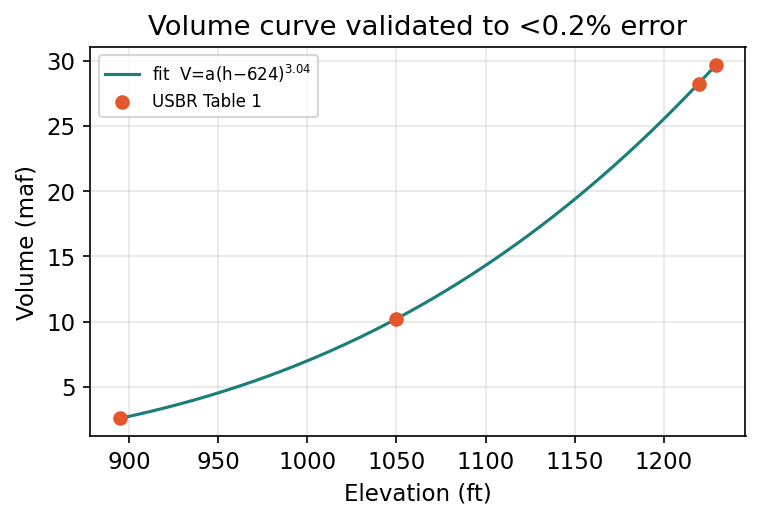
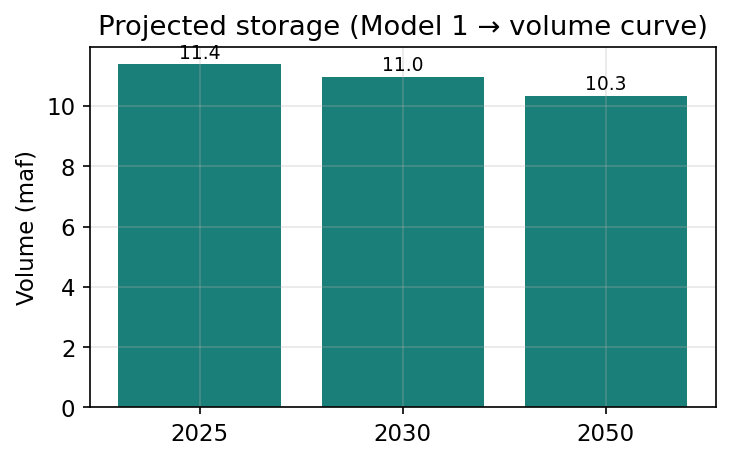
- Volume curve validated to 0.19% against USBR Table 1
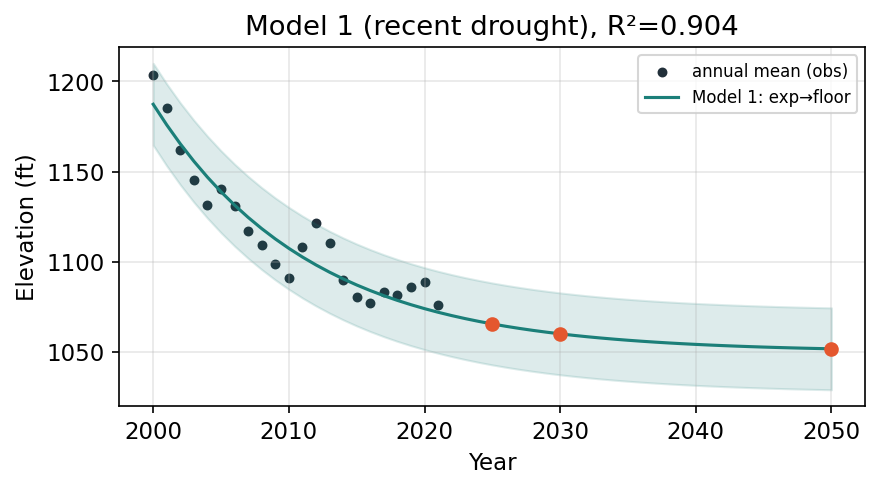
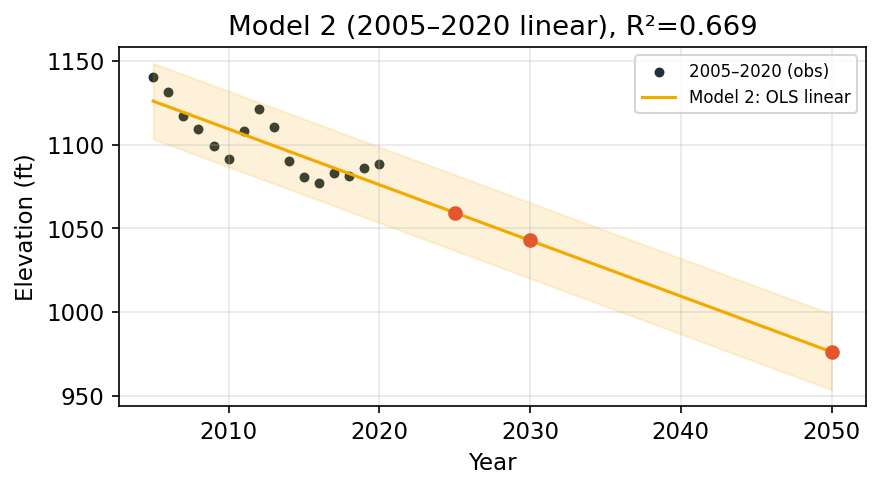
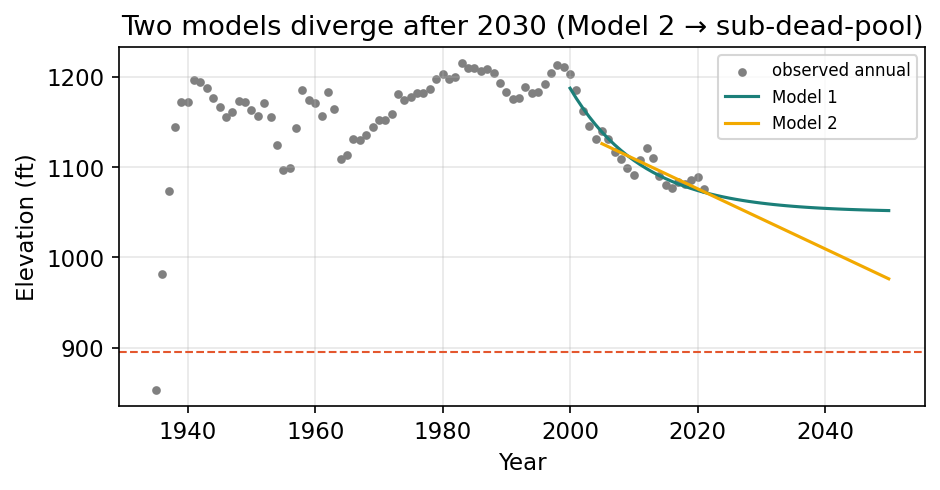
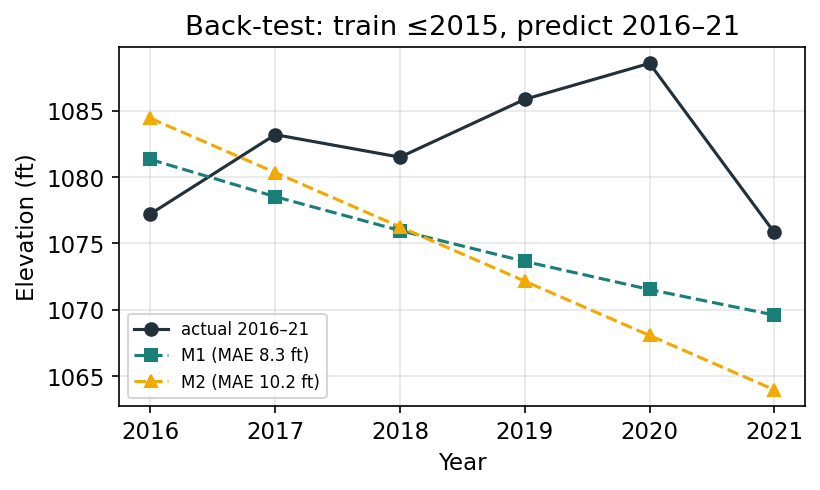
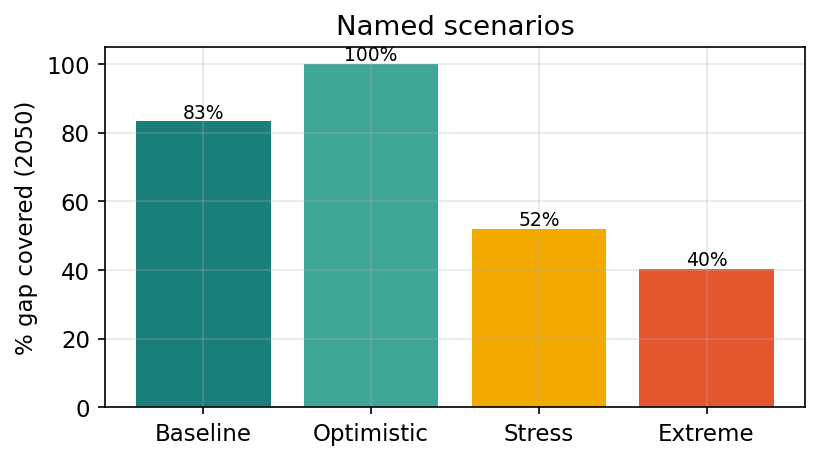
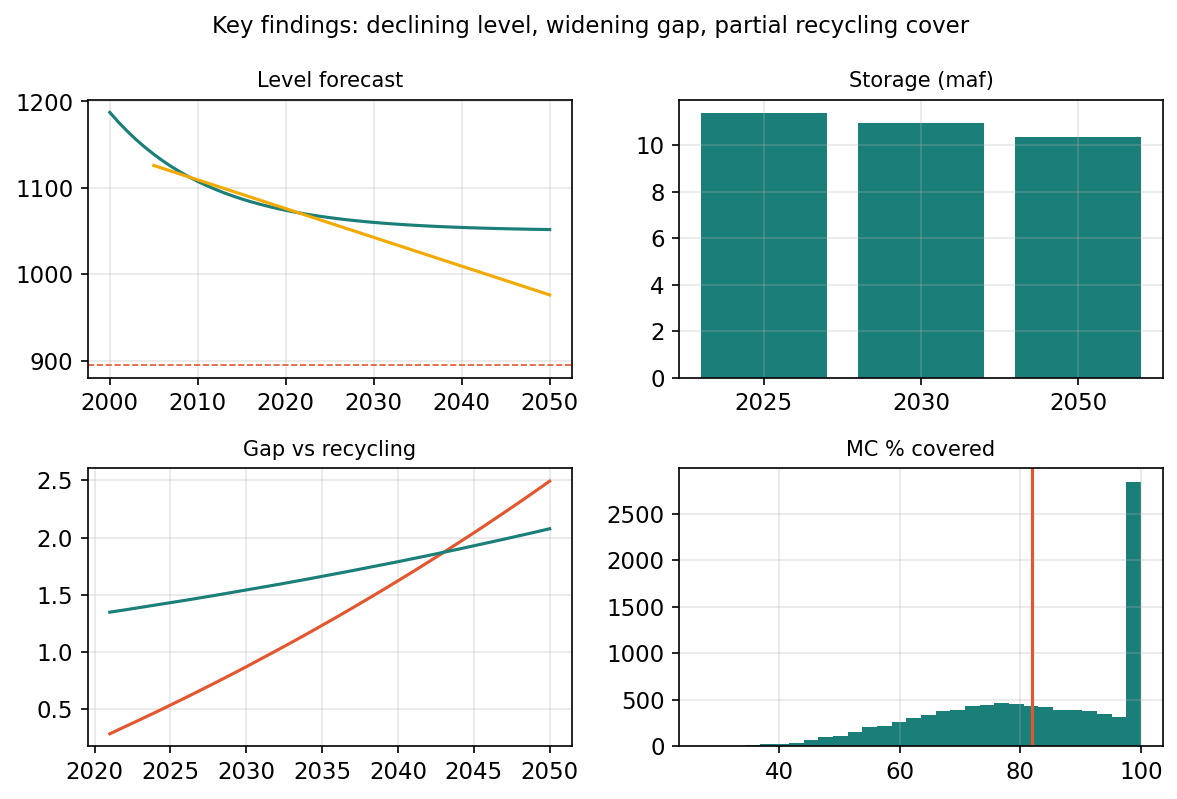
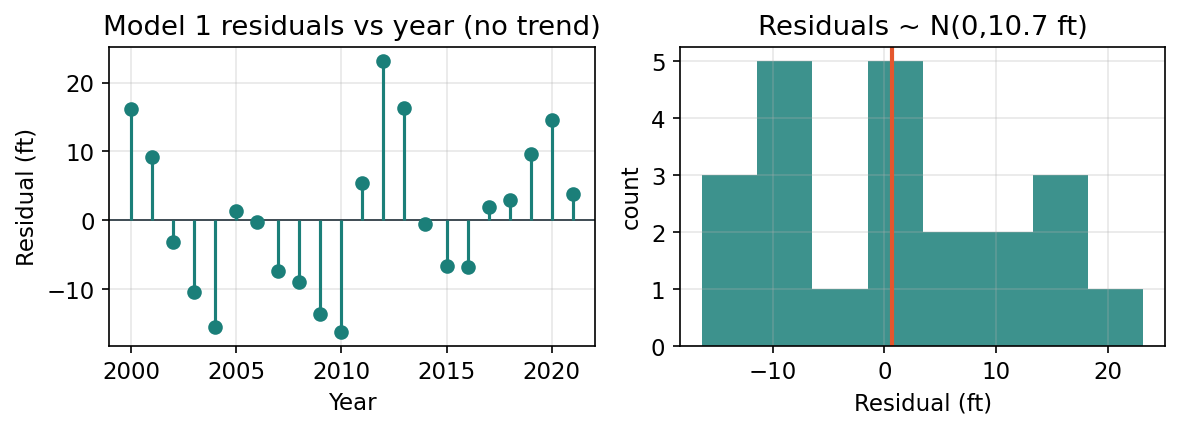
- 2050 level: 1052 ft (Model 1, R²=0.90, back-test 8.3 ft) vs 976 ft under stress
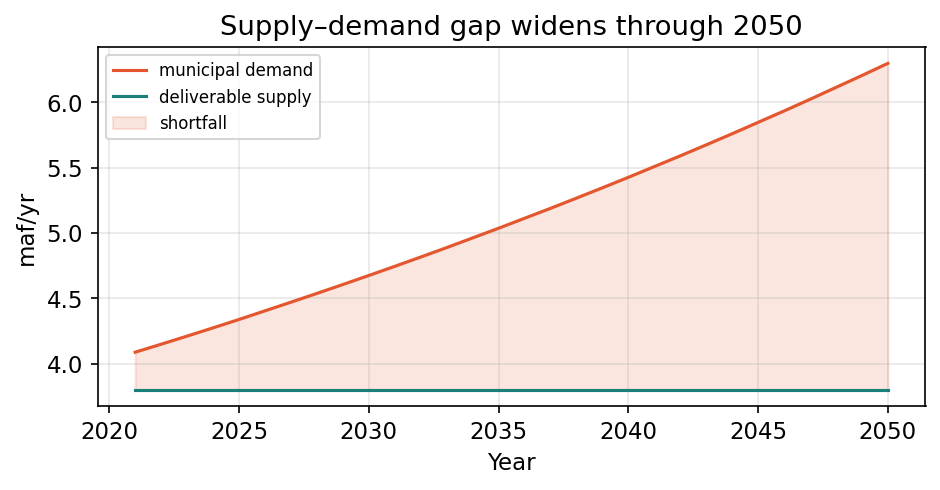
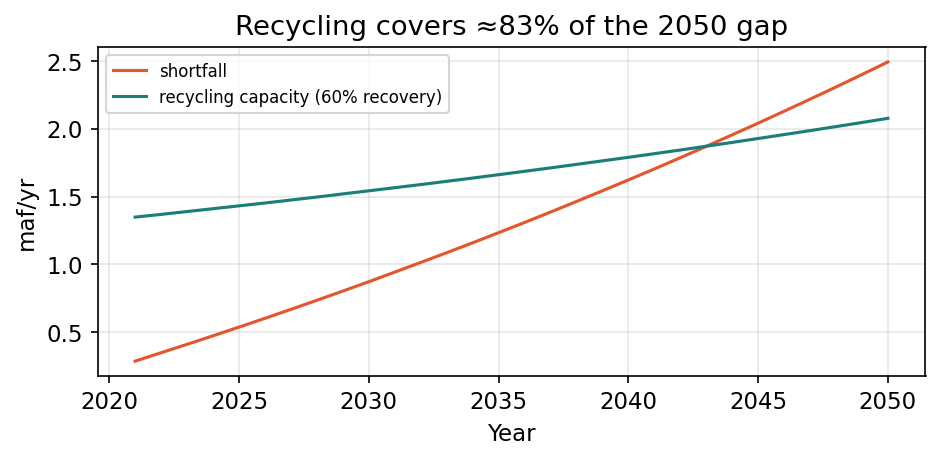
- 2050 shortfall 2.49 maf; recycling covers 100% to 2043, 83% by 2050
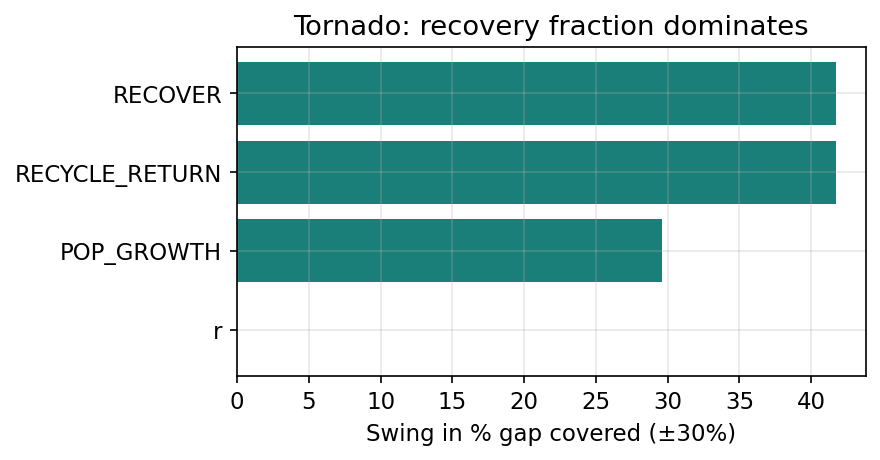
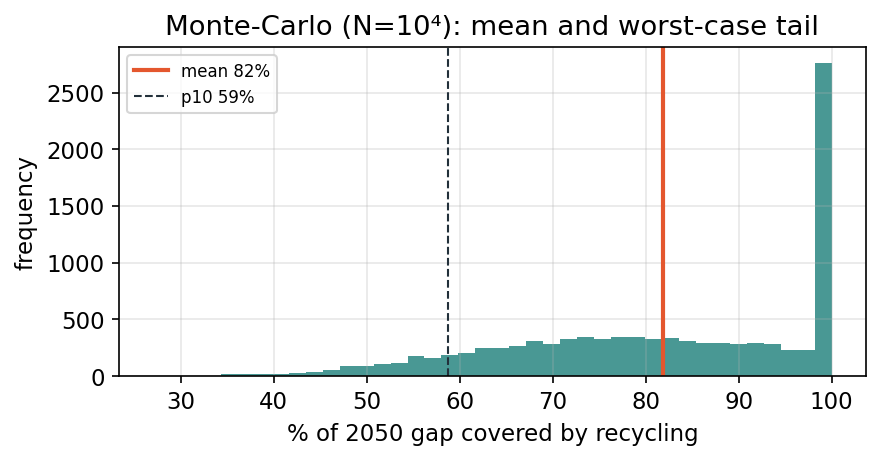
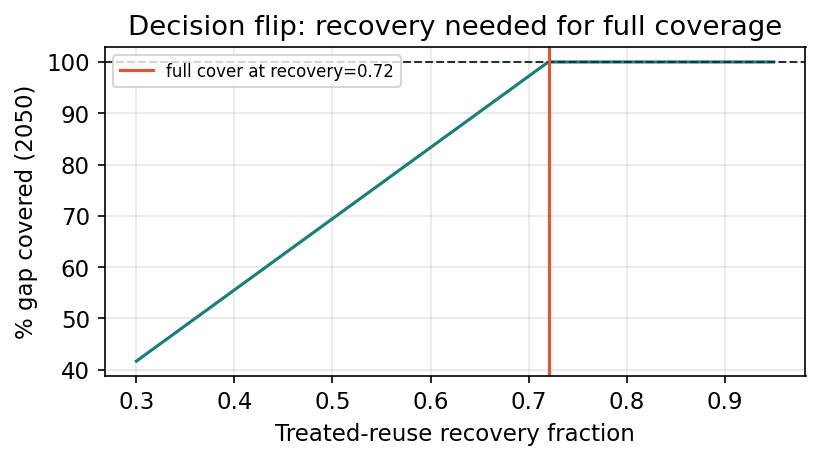
- Monte-Carlo mean coverage 82% (p10 59%); full coverage needs recovery ρ ≥ 0.72
Every Figure
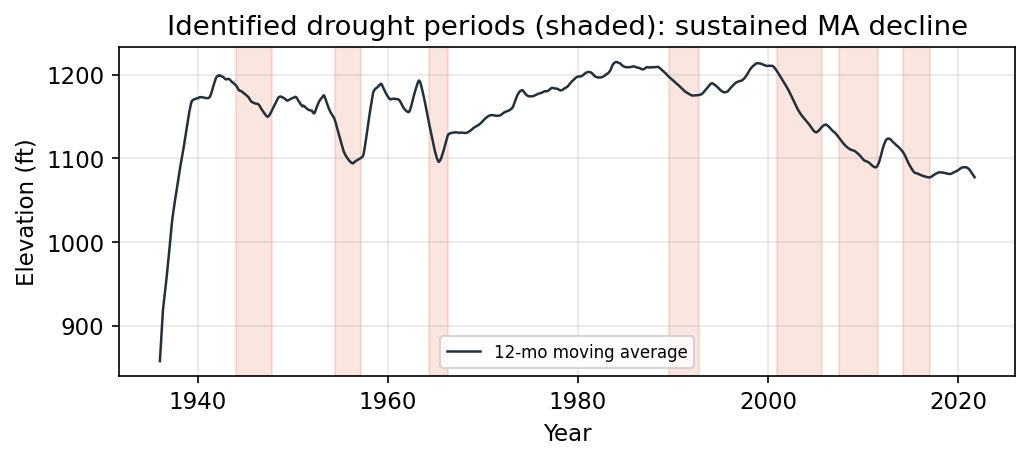
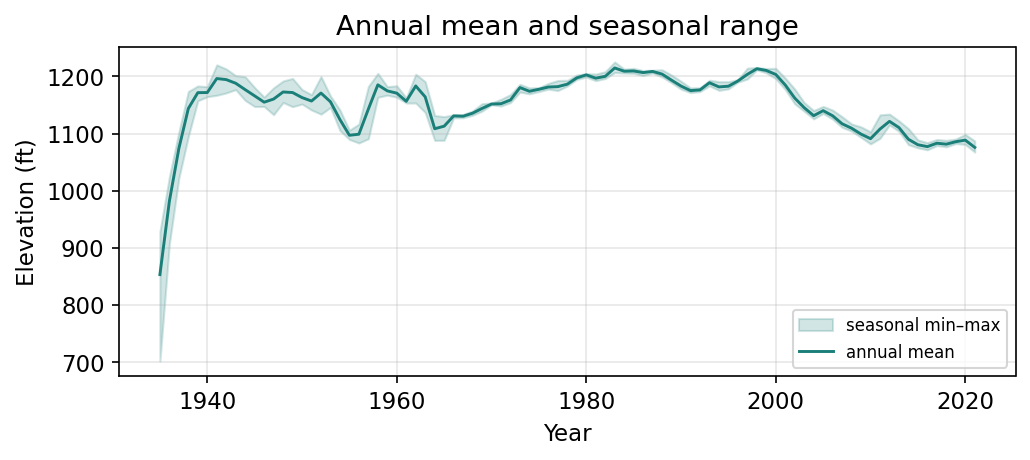
17 figures · a coupled pipeline: level → storage → budget → recycling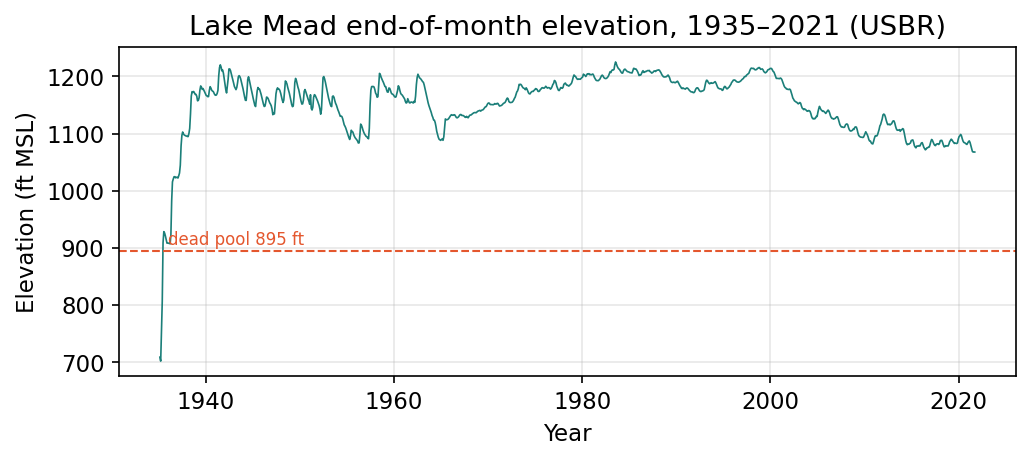
This paper was produced end to end through the same seven-stage method Tian2 uses to coach teams — decode, strategy, data & code, sensitivity, draft, summary, and a submission compliance pass — with every figure traced back to real, executed computation on public U.S. Bureau of Reclamation data. It is shown as a standard to aim for, not as a submission. To see the assistant run those stages live on a different problem, watch the assistant work.