IPC · Section B & C · Free response

Waves and Thermal

18 questions — reveal each answer and worked solution.

2010-11B · Writtend2Waves and Thermal · Heat transfer mechanisms

(2010-11) Heat loss from a house can be reduced by using double glazing. Explain how double glazing reduces heat loss from a warm room to the colder outside environment.

Show worked solution
Explanation

Double glazing uses two panes of glass separated by a thin sealed gap of air (or another gas). This reduces heat transfer from the warm room to the colder outside by reducing all three heat-transfer mechanisms.

Conduction

Heat conducted through a window depends on the thermal conductivity $k$ of the material and the thickness of the layers. In a single pane, heat can conduct relatively easily through the glass. In double glazing, the air gap has a much lower thermal conductivity than glass, so it acts as an insulating layer and greatly reduces the rate of heat flow. A useful relationship is $$ \dot{Q}=\frac{kA\Delta T}{L} $$ where $\dot{Q}$ is the rate of heat transfer, $A$ is window area, $\Delta T$ is the temperature difference, and $L$ is thickness. Making the heat travel through two panes plus an insulating gas layer increases the effective $L$ and introduces a low-$k$ layer, so $\dot{Q}$ is smaller.

Convection

Convection requires bulk motion of a fluid. The gap between the panes is thin and sealed, so the air (or gas) cannot circulate freely to set up convection currents. With little or no convective mixing, heat transfer across the gap is much slower than it would be if the warm air next to the inner pane could rise and be replaced by cooler air repeatedly.

Thermal radiation

Warm objects emit infrared radiation. Double glazing reduces net radiative loss because the inner pane radiates to the air gap and the second pane, and the outer pane then radiates to the outside, so the transfer is less direct than with a single pane. Many double-glazed windows also have a low-emissivity coating on one pane, which reflects infrared radiation back into the room and lowers radiative heat transfer further.

Overall effect

By adding a trapped insulating gas layer and an extra pane, double glazing reduces conduction, suppresses convection, and can reduce radiation, so the total heat loss from the warm room to the colder outside environment is significantly decreased.

2011-11B · Writtend2Waves and Thermal · Evaporative cooling

(2011-11) Even on a warm day, when the air is warm, you still feel cold when coming out of the sea or out of swimming pool. A similar effect can be observed in the laboratory by pouring a small amount of ethanol on to the back of the hand. Even though the ethanol is warm, your hand still feels cold. Explain why, in either of these examples, you feel cold even though the air around you is warm.

Show worked solution
Explanation

When you come out of the sea or a swimming pool, or when warm ethanol is poured on your skin, a thin layer of liquid covers the surface of your skin. The key process is evaporation. To change from liquid to vapour, molecules must gain enough energy to break free from the liquid. That energy is taken mainly as thermal energy from your skin.

The molecules that escape first are typically the highest-energy molecules in the liquid. When these energetic molecules leave, the average kinetic energy of the remaining liquid decreases, so the liquid layer cools. Because this liquid layer is in direct contact with your skin, it draws energy from your skin to continue evaporating, so your skin temperature drops. Your cold receptors respond strongly to this drop in skin temperature, so you feel cold even if the surrounding air is warm.

A warm day does not prevent this effect because the air temperature might still be lower than your skin temperature (about $37^\circ$C), and more importantly, evaporation can remove heat from your skin much faster than warm air can replace it by convection. The net energy transfer is still away from your body.

Ethanol often feels even colder than water because it is more volatile (it evaporates more readily), so the evaporation rate is higher. A higher evaporation rate means a larger rate of energy removal from your skin. The cooling associated with evaporation is quantified by the latent heat of vaporisation $L$, giving the heat taken from the skin when mass $m$ evaporates as $$ Q = mL $$ Since $L$ is large for common liquids, even a small amount evaporating can remove noticeable energy, producing a rapid skin temperature drop and a strong sensation of cold.

2011-14C · Writtend3Waves and Thermal · Resistance–temperature graph analysis

(2011-14: Using Graphs - change of resistance with temperature) A group of students are investigating how the resistance of a particular material changes with temperature. Their teacher suggests that the relationship is given by

$$ \begin{array}{ll} \mathrm{R}=\mathrm{R}_{0}+\alpha \mathrm{T} & \mathrm{R}=\operatorname{Resistance}(\Omega) \\ & \mathrm{R}_{0}=\operatorname{Resistance} \text { at } 0^{\circ} \mathrm{C}(\Omega)-\text { a constant } \\ & \mathrm{T}=\text { temperature }\left({ }^{\circ} \mathrm{C}\right) \\ & \alpha=\text { a constant } \end{array} $$

a) Given an ammeter, voltmeter, variable power supply and wires etc. as necessary, draw a suitable circuit that would enable the students to measure the resistance of the wire.
b) The students take readings of resistance and temperature. Suggest how they could make their results as reliable as possible
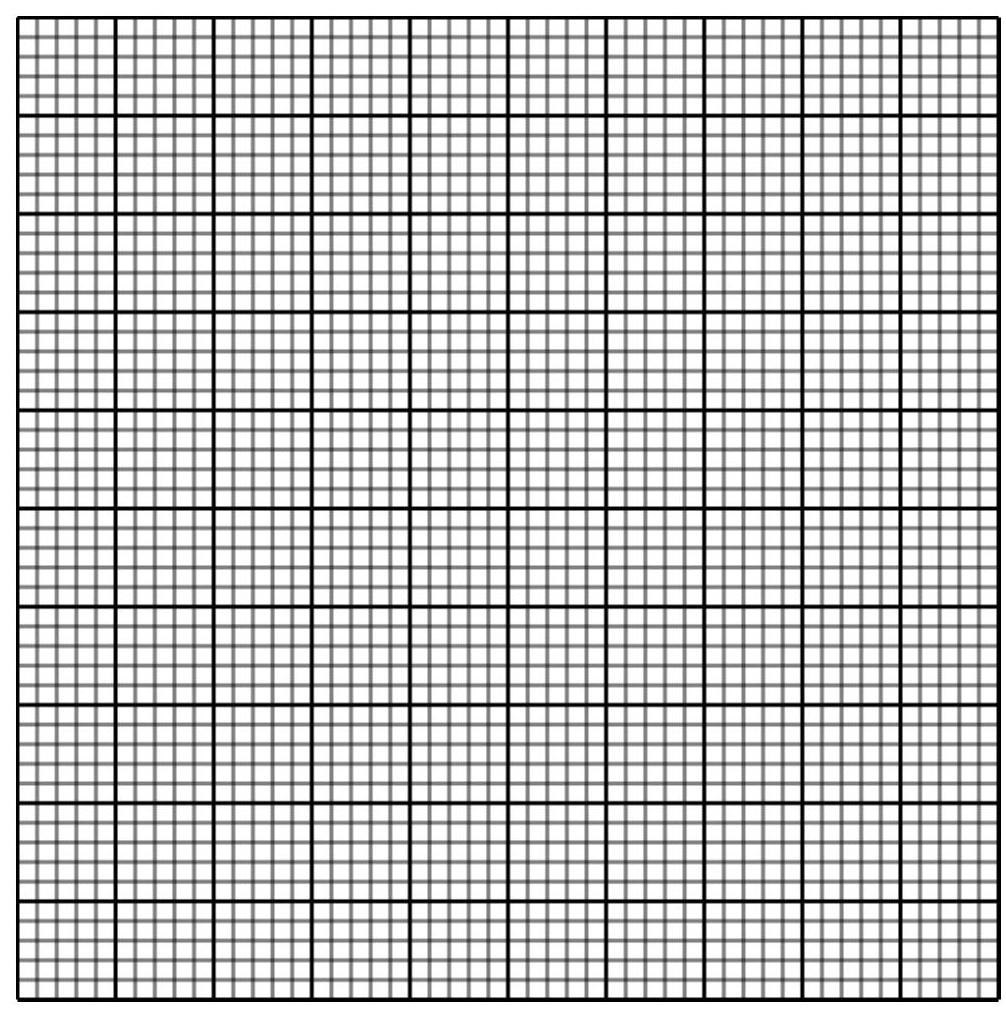
c) Use the results given in the table to plot a suitable graph of resistance and temperature.

Add a line of best fit.

Temperature $\left({ }^{\circ} \mathrm{C}\right)$Resistance $(\Omega)$
2020.0
3021.1
4022.0
5023.0
6024.1
7025.2
8026.5
9027.8
figure

d) To what extent do the results of the experiment support the relationship suggested by the teacher?
e) Use the graph, or the data in the table, to determine the best estimate for values for $\mathrm{R}_{0}$ and $\alpha$
f) State suitable units for $\alpha$

Show worked solution
(a)

A suitable method is to measure the potential difference $V$ across the test wire and the current $I$ through it, then calculate the resistance using $R=V/I$. The ammeter must be in series with the wire and the voltmeter must be in parallel with the wire; a variable power supply allows the current (and therefore heating) to be controlled. A suitable circuit is $$ \begin{circuitikz} \draw (0,0) to[battery1,l=variable power supply] (0,3) to[ammeter,l=A] (3,3) to[R,l=test wire] (6,3) to[closing switch,l=switch] (6,0) -- (0,0); \draw (3,3) -- (3,1.2) to[voltmeter,l=V] (6,1.2) -- (6,3); \end{circuitikz} $$ The resistance at each temperature is found from the meter readings using $R=V/I$.

(b)

Reliability is improved by repeating readings of $V$ and $I$ at each temperature and taking a mean value for $R$, using a wide range of temperatures, and allowing the wire to reach thermal equilibrium at each temperature before taking readings (for example, leaving it in a stirred water bath until the temperature is steady). To reduce systematic and heating errors, use a small current (or switch on only briefly) so the measuring current does not significantly increase the wire temperature above the thermometer reading, keep lead connections tight and unchanged, and read analogue scales at eye level to reduce parallax.

(c)

A suitable graph is resistance $R$ on the vertical axis against temperature $T$ on the horizontal axis, since the suggested relationship $R=R_0+\alpha T$ predicts a straight line with gradient $\alpha$ and vertical intercept $R_0$. Plot the points from the table and draw a straight line of best fit through the general trend (not a join-the-dots line). A best-fit line for the data is well represented by $$ R \approx 17.7 + 0.110\,T $$ with $R$ in ohms and $T$ in degrees Celsius; this line can be added to the plotted points.

(d)

The results support the teacher’s relationship to a good extent because the plotted points lie close to a straight line, showing that $R$ increases approximately linearly with $T$ over $20^\circ$C to $70^\circ$C. There are small deviations from perfect linearity (of order a few tenths of an ohm) over $70^\circ$C to $90^\circ$C, and this part does not fit the trend line.

(e)

From $R=R_0+\alpha T$, the gradient of the $R$--$T$ graph is $\alpha$ and the intercept at $T=0^\circ$C is $R_0$. Using two widely separated points to estimate the gradient (for example, the endpoints of the table), $$ \alpha \approx \frac{\Delta R}{\Delta T}=\frac{27.8-20.0}{90-20}=\frac{7.8}{70}\approx 0.111\ \Omega/^\circ\mathrm{C} $$ Then $$ R_0 \approx R-\alpha T \approx 20.0-(0.111)(20)\approx 17.8\ \Omega $$ A best-estimate using the overall best-fit line gives essentially the same values: $R_0 \approx 17.7\ \Omega$ and $\alpha \approx 0.110\ \Omega/^\circ$C.

(f)

Since $\alpha$ is the gradient of a graph of resistance (ohms) against temperature (degrees Celsius), suitable units are $\Omega/^\circ$C (equivalently $\Omega\,^\circ\mathrm{C}^{-1}$, and numerically the same as $\Omega/\mathrm{K}$ for temperature changes).

2012-11B · Writtend2Waves and Thermal · Dispersion by a prism

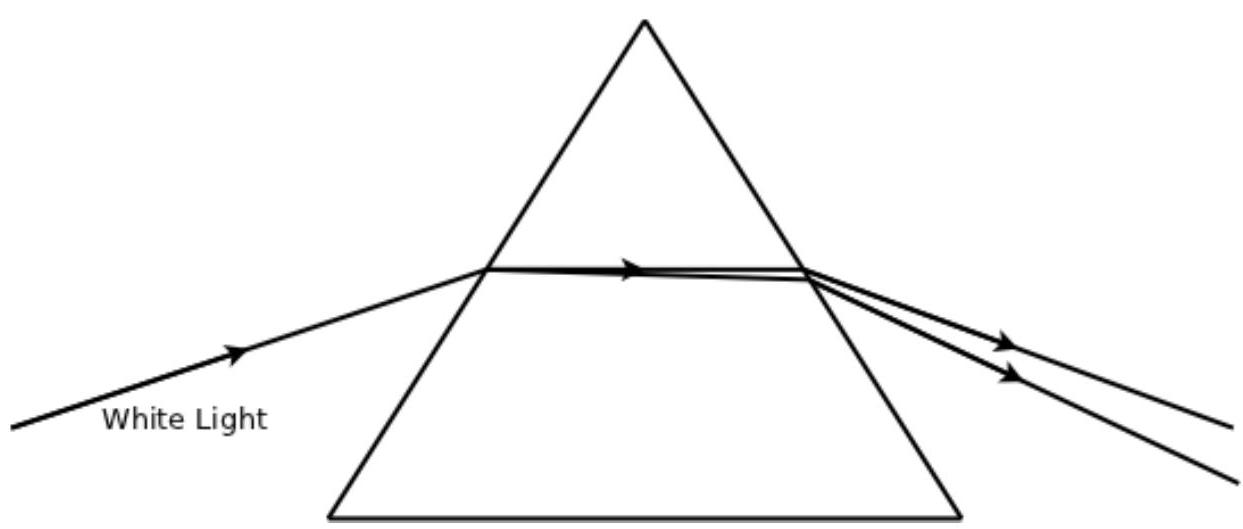
(2012-11) White light disperses when passed through a prism, as shown below:

figure

Explain why the white light is split up into the different colours of the visible spectrum.

Show worked solution
When white light enters the prism, it slows down because glass has a higher refractive index than air, so the ray changes direction at the surface (refraction). Different colours split up because the refractive index of glass depends on wavelength, so each colour travels at a different speed in the prism and therefore refracts by a different amount. This is called dispersion. The basic relationship is $$ n=\frac{c}{v} $$ so a larger refractive index $n$ means a smaller speed $v$ inside the glass. In most glasses, shorter wavelengths (violet/blue) have a larger $n$ than longer wavelengths (red), so violet light travels more slowly than red light in the prism. Because violet has the larger change in speed at each boundary, it bends more towards the normal on entering the prism and more away from the normal on leaving, giving a larger overall deviation. Red light has the smallest change in speed and bends the least. As a result, the emerging light rays spread out into different directions, forming the visible spectrum.
2013-13C · Writtend3Waves and Thermal · Gas laws and absolute zero

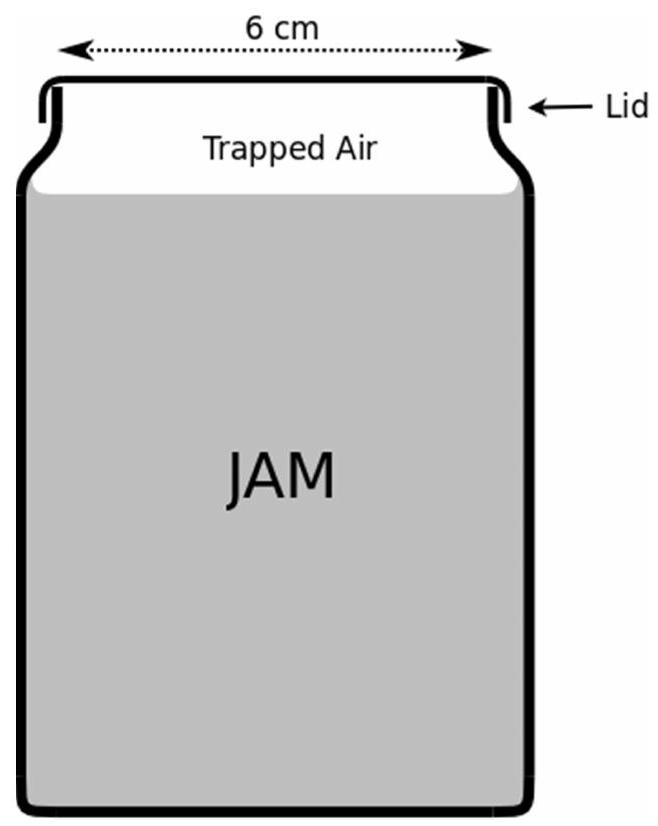
(2013-13: A question about opening a jam jar) When jam is made, it is put into the jam jar and the top screwed down whilst the jam is still hot. The top makes an airtight seal with the jar and the air trapped above the jam cools and so the pressure of the trapped air reduces.

figure

Useful information:

For the air:

$$\mathrm{p} / \mathrm{T}=\text { constant }$$

assuming no air escapes/enters and the volume of the trapped air remains constant $\mathrm{p}=$ pressure of the trapped air
$\mathrm{T}=$ Temperature in Kelvin

Atmospheric pressure $=100 \mathrm{kPa}$ (at room temperature)
Absolute zero $=-273{ }^{\circ} \mathrm{C}$

(a) Calculate the force, due to atmospheric pressure, acting downwards on the top of the circular lid of the jam jar

(b) The jam and the trapped air were initially at a temperature of $85^{\circ} \mathrm{C}$ when the jam was put into the jar and lid secured. Show that the pressure of the trapped air, once it has cooled to a room temperature of $15^{\circ} \mathrm{C}$ inside the jar is approximately 80 kPa

(c) Calculate the resultant force acting on the lid of the jam jar

(d) Explain why running the jam jar under the hot tap can make it easier to remove the top

Show worked solution
(a)

The downward force due to atmospheric pressure is given by $F=pA$, where $p=100\,\mathrm{kPa}=1.0\times 10^{5}\,\mathrm{Pa}$ and $A$ is the area of the circular lid. From the diagram, the lid has diameter $8.0\,\mathrm{cm}$, so $r=4.0\,\mathrm{cm}=0.040\,\mathrm{m}$ and $$ A=\pi r^{2}=\pi(0.040)^{2}=5.03\times 10^{-3}\,\mathrm{m^{2}} $$ $$ F_{\text{atm}}=p_{\text{atm}}A=(1.0\times 10^{5})(5.03\times 10^{-3})=5.03\times 10^{2}\,\mathrm{N}\approx 5.0\times 10^{2}\,\mathrm{N} $$ So the atmospheric pressure pushes down on the lid with a force of about $5.0\times 10^{2}\,\mathrm{N}$.

(b)

While the jar is being sealed, the trapped air is at atmospheric pressure, so initially $p_{1}=100\,\mathrm{kPa}$ at $85^\circ\mathrm{C}$. With constant volume and fixed amount of gas, $p/T=\text{constant}$, with $T$ in Kelvin. Converting temperatures: $T_{1}=85+273=358\,\mathrm{K}$ and $T_{2}=15+273=288\,\mathrm{K}$. $$ \frac{p_{1}}{T_{1}}=\frac{p_{2}}{T_{2}}\;\;\Rightarrow\;\;p_{2}=p_{1}\frac{T_{2}}{T_{1}}=100\,\mathrm{kPa}\times\frac{288}{358}=80.4\,\mathrm{kPa}\approx 80\,\mathrm{kPa} $$ So the cooled trapped-air pressure is approximately $80\,\mathrm{kPa}$.

(c)

The resultant force on the lid is due to the pressure difference between outside (atmosphere) and inside (trapped air). Since $p_{\text{atm}}=100\,\mathrm{kPa}$ and $p_{\text{in}}\approx 80\,\mathrm{kPa}$, the net pressure is $\Delta p=20\,\mathrm{kPa}=2.0\times 10^{4}\,\mathrm{Pa}$ acting downward. Using the same lid area $A=5.03\times 10^{-3}\,\mathrm{m^{2}}$, $$ F_{\text{resultant}}=\Delta p\,A=(2.0\times 10^{4})(5.03\times 10^{-3})=1.01\times 10^{2}\,\mathrm{N}\approx 1.0\times 10^{2}\,\mathrm{N} $$ So the resultant force on the lid is about $1.0\times 10^{2}\,\mathrm{N}$ downward.

(d)

Running the jar under a hot tap warms the trapped air, increasing its temperature; at (approximately) constant volume, increasing $T$ increases $p$ because $p/T=\text{constant}$, so the inside pressure rises toward atmospheric pressure, reducing the pressure difference $\Delta p$ and therefore reducing the downward clamping force on the lid, making it easier to twist open; additionally, the metal lid expands more than the glass jar when heated, which can help break the seal.

2014-12B · Writtend3Waves and Thermal · Parallel resistors and power dissipation

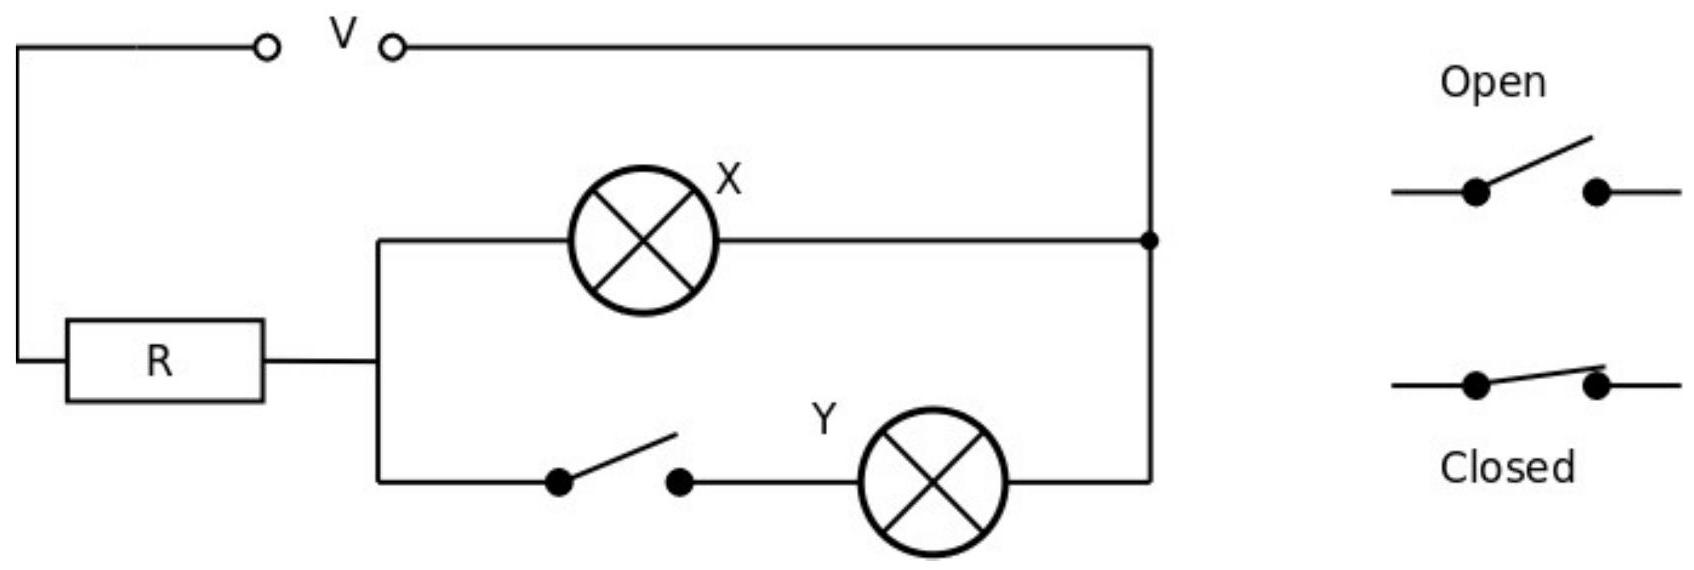
(2014-12) In the circuit shown, the power supply is a fixed voltage V and the resistor is a fixed value $R$.

The two bulbs are identical.

When the switch is open just bulb $X$ is lit.

When the switch is closed both bulb $X$ and bulb $Y$ are lit.

State and explain whether the brightness of bulb X will increase, decrease or stay the same when the switch is changed from open to closed.

figure
Show worked solution
Brightness of bulb X when the switch is closed

Treat each identical bulb as a resistor of (hot) resistance $r$, and use the fact that the brightness of a filament bulb is determined by the electrical power it dissipates, $P$.

When the switch is open, only bulb $X$ is connected, so the circuit is a series combination of $R$ and $r$. The current is $I_\text{open}=V/(R+r)$, so the power in bulb $X$ is $$ P_{X,\text{open}}=I_\text{open}^2\,r=\left(\frac{V}{R+r}\right)^2 r=\frac{V^2 r}{(R+r)^2}. $$

When the switch is closed, bulbs $X$ and $Y$ are in parallel, so their equivalent resistance is $r_\parallel=r/2$. This parallel pair is still in series with $R$, so the total resistance is $R+r/2$. The total current is $I_\text{total}=V/(R+r/2)$, and because the bulbs are identical the current splits equally, so the current in bulb $X$ is $I_{X,\text{closed}}=I_\text{total}/2=V/(2R+r)$. Hence the power in bulb $X$ is $$ P_{X,\text{closed}}=I_{X,\text{closed}}^2\,r=\left(\frac{V}{2R+r}\right)^2 r=\frac{V^2 r}{(2R+r)^2}. $$

To compare brightness, compare the powers: since $R>0$, then $2R+r>R+r$, so $(2R+r)^2>(R+r)^2$, and therefore $$ P_{X,\text{closed}}=\frac{V^2 r}{(2R+r)^2}<\frac{V^2 r}{(R+r)^2}=P_{X,\text{open}}. $$

So the brightness of bulb $X$ decreases when the switch is closed, because adding bulb $Y$ in parallel reduces the load resistance, increasing the total current and hence increasing the voltage drop across the fixed series resistor $R$, leaving a smaller potential difference across bulb $X$ and reducing its power output.

2015-11B · Writtend2Waves and Thermal · Kirchhoff's voltage law and EMF

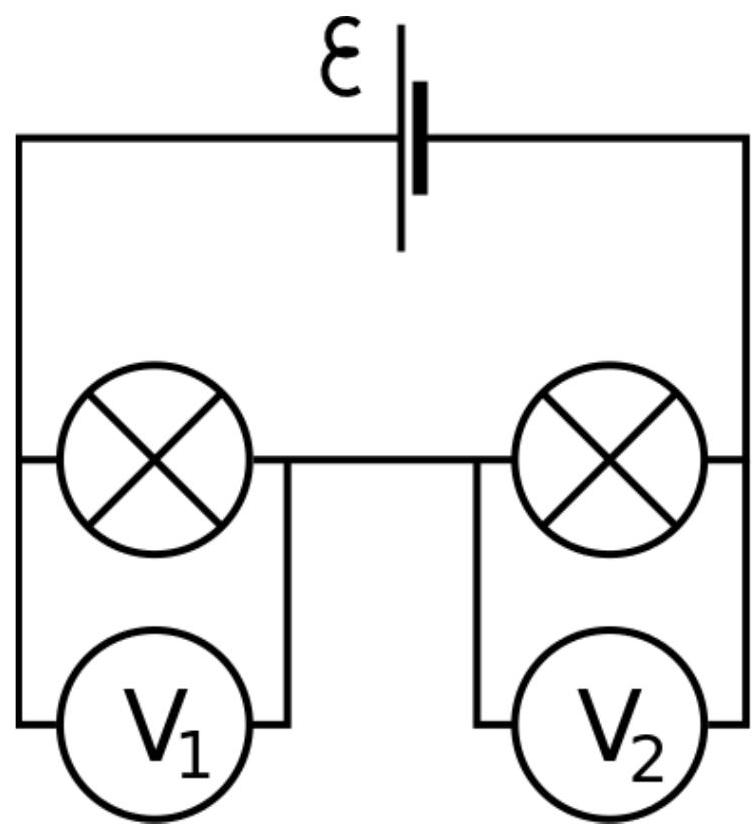
(2015-11) A series circuit contains a cell and two bulbs.

The emf (voltage) of the cell is $\varepsilon$ volts.
The potential differences across the two bulbs are $\mathrm{V}_{1}$ and $\mathrm{V}_{2}$ respectively.
($\mathrm{V}_{1}$ and $\mathrm{V}_{2}$ are not necessarily the same).

Explain why the emf of the cell is equal to the sum of the potential differences across the bulbs.

figure

i.e. explain why $\varepsilon = \mathrm{V}_{1} + \mathrm{V}_{2}$

Show worked solution
Explanation

The emf $\varepsilon$ of the cell is the energy transferred by the cell to each unit charge, so $\varepsilon=\dfrac{W_{\text{cell}}}{Q}$, while each potential difference across a bulb is the energy transferred from the charge to that bulb per unit charge, so $V_1=\dfrac{W_1}{Q}$ and $V_2=\dfrac{W_2}{Q}$. In a series circuit the same charge $Q$ passes through every component, so the energy per unit charge gained from the cell must equal the total energy per unit charge lost in the components, because a charge that returns to its starting point has no net change in energy (conservation of energy, equivalent to Kirchhoff’s loop rule: the algebraic sum of potential changes around a closed loop is zero). Therefore the potential rise provided by the cell equals the sum of the potential drops across the two bulbs: $$\varepsilon=V_1+V_2$$ This relation holds for an ideal cell (negligible internal resistance); if internal resistance were included, an additional potential drop inside the cell would also appear in the loop sum.

2016-13C · Writtend4Waves and Thermal · Stress, tensile strength, and cable mechanics

(2016-13: This question is about designing an elevator in a tall building.)

A cable that hangs vertically has a maximum possible length beyond which it can no longer support its own weight.

(a) For a steel cable with a diameter of 4 cm and a length of 1 m, show that the mass of the cable is approximately 10 kg.

Given: $\mathrm{d}=4\ \mathrm{cm}$, $\mathrm{L}=1\ \mathrm{m}$, Density of steel $=8000\ \mathrm{kg\,m^{-3}}$.

(b) Stress ($\sigma$) is defined as Force $\div$ Cross sectional Area and has units of Pascals (Pa). Stress $=F/A$ i.e. $\sigma=F/A$.

Calculate the stress at the top of the 1 m cable, where it is joined to the rigid support.

The maximum stress that a steel cable under tension can withstand, before it breaks, is 400 MPa. This is often referred to as the ultimate tensile strength of the material.

(c) Calculate the maximum length of a steel cable with a diameter of 4 cm that can be hung vertically from a suitable rigid support such that it can support its own weight. (d) Explain what effect increasing the diameter of the cable would have on the maximum length of the cable calculated in part (c).

Consider an elevator, supported by the same steel cable, with the following specifications:

  • Mass of elevator $=2000\ \mathrm{kg}$
  • Maximum mass of passengers $=1400\ \mathrm{kg}$
  • Maximum acceleration/deceleration $=2.5\ \mathrm{m\,s^{-2}}$
  • Maximum permitted stress in cable $=\frac{1}{4}$ ultimate tensile strength of cable

(e) Calculate the maximum force exerted on the elevator by the cable. (f) Hence calculate the maximum length of the elevator cable when using the same steel cable with a diameter of 4 cm.
Show worked solution
(a)

The cable is a cylinder with diameter $d=4\ \mathrm{cm}=0.04\ \mathrm{m}$, so its cross-sectional area is $$ A=\frac{\pi d^{2}}{4}=\frac{\pi(0.04)^{2}}{4}=1.26\times 10^{-3}\ \mathrm{m}^{2}. $$ For a length $L=1\ \mathrm{m}$, the volume is $V=AL=1.26\times 10^{-3}\ \mathrm{m}^{3}$. Using the density of steel $\rho=8000\ \mathrm{kg\,m^{-3}}$, $$ m=\rho V=(8000)(1.26\times 10^{-3})\approx 10.05\ \mathrm{kg}\approx 10\ \mathrm{kg}. $$

(b)

The weight of the 1 m cable acts at the top where it joins the support: $$ W=mg=(10.05)(9.81)\approx 98.6\ \mathrm{N}\approx 100\ \mathrm{N}. $$ The stress at the top is $$ \sigma=\frac{F}{A}=\frac{W}{A}=\frac{100}{1.26\times 10^{-3}}\approx 7.94\times 10^{4}\ \mathrm{Pa}=79.4\ \mathrm{kPa}\approx 80\ \mathrm{kPa}. $$

(c)

For a cable of length $L$ and cross-sectional area $A$, the volume is $V=AL$ and the mass is $m=\rho V=\rho AL$. The weight is $W=mg=\rho ALg$, and the stress at the top is $\sigma=W/A=\rho Lg$. Setting this equal to the ultimate tensile strength $\sigma_{\max}=400\ \mathrm{MPa}=4.0\times 10^{8}\ \mathrm{Pa}$, $$ \rho Lg=\sigma_{\max}\quad\Rightarrow\quad L=\frac{\sigma_{\max}}{\rho g}=\frac{4.0\times 10^{8}}{(8000)(9.81)}\approx 5097\ \mathrm{m}\approx 5000\ \mathrm{m}. $$

(d)

Increasing the diameter has NO effect on the maximum length. The stress at the top of a vertically-hung cable is $\sigma=\rho Lg$, which depends only on the material density $\rho$, the length $L$, and $g$ — the cross-sectional area $A$ (and therefore the diameter) cancels out.

(e)

The maximum force exerted on the elevator by the cable must support both the total weight and provide the maximum upward acceleration. Total mass (elevator + passengers): $m=2000+1400=3400\ \mathrm{kg}$. Weight: $W=mg=(3400)(9.81)=33\,354\ \mathrm{N}\approx 33\,400\ \mathrm{N}$.

To accelerate upward at $a_{\max}=2.5\ \mathrm{m\,s^{-2}}$, the net force needed is $F_{\text{net}}=ma_{\max}=(3400)(2.5)=8500\ \mathrm{N}$.

Therefore the maximum tension (force) in the cable is $$ T_{\max}=W+F_{\text{net}}=33\,400+8500=41\,900\ \mathrm{N}\approx 42\,500\ \mathrm{N}. $$

(f)

The maximum permitted stress is one-quarter of the ultimate tensile strength: $$ \sigma_{\text{perm}}=\frac{1}{4}\sigma_{\max}=\frac{1}{4}(400\ \mathrm{MPa})=100\ \mathrm{MPa}=1.0\times 10^{8}\ \mathrm{Pa}. $$

This stress is produced by the weight of a length $L$ of cable plus the weight of the loaded elevator. For a cable of length $L$, the weight of the cable alone is $W_{\text{cable}}=\rho ALg$, and the total weight supported at the top is $W_{\text{total}}=W_{\text{cable}}+W_{\text{elevator}}$. The stress at the top is $$ \sigma=\frac{W_{\text{total}}}{A}=\frac{\rho ALg+W_{\text{elevator}}}{A}=\rho Lg+\frac{W_{\text{elevator}}}{A}. $$

Setting $\sigma=\sigma_{\text{perm}}$ and solving for $L$: $$ \rho Lg+\frac{W_{\text{elevator}}}{A}=\sigma_{\text{perm}} \quad\Rightarrow\quad L=\frac{1}{\rho g}\left(\sigma_{\text{perm}}-\frac{W_{\text{elevator}}}{A}\right). $$

Using $W_{\text{elevator}}=33\,400\ \mathrm{N}$ (from part e) and $A=1.26\times 10^{-3}\ \mathrm{m}^{2}$: $$ \frac{W_{\text{elevator}}}{A}=\frac{33\,400}{1.26\times 10^{-3}}=2.65\times 10^{7}\ \mathrm{Pa}=26.5\ \mathrm{MPa}. $$

Therefore $$ L=\frac{1}{(8000)(9.81)}\bigl(1.0\times 10^{8}-2.65\times 10^{7}\bigr) =\frac{7.35\times 10^{7}}{7.85\times 10^{4}}\approx 936\ \mathrm{m}\approx 830\ \mathrm{m}. $$

The maximum length of elevator cable is about $830\ \mathrm{m}$.

2017-12B · Writtend2Waves and Thermal · Newton's law of cooling

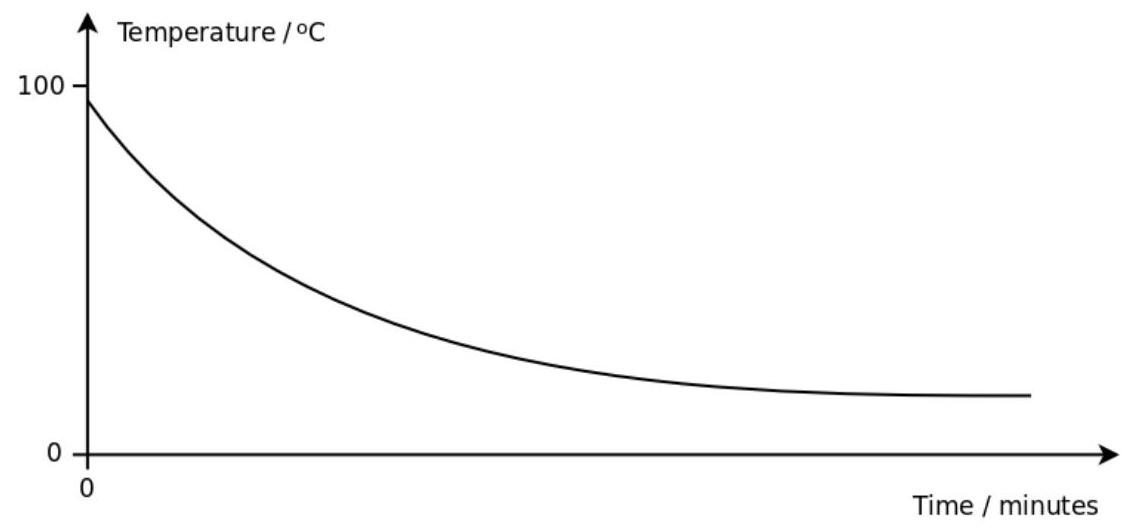
(2017-12) A beaker of boiling water was allowed to cool naturally.

Readings of temperature were recorded every minute and the results were plotted on the graph with a line of best fit as shown.

figure

Explain the shape of the graph.

Show worked solution
Explanation of the shape of the graph

The curve falls steeply at first and then becomes less steep, approaching a nearly horizontal line, because the cooling rate depends on how much hotter the water is than its surroundings. When the water is just removed from boiling, the temperature difference $\Delta T = T - T_s$ (where $T_s$ is the surrounding/room temperature) is large, so energy is transferred to the surroundings quickly by convection to the air, conduction through the beaker, and thermal radiation, giving a large negative gradient (rapid drop in $T$). As the water cools, $\Delta T$ becomes smaller, so the driving force for heat transfer decreases and the gradient becomes less negative (cooling slows), producing the curved shape rather than a straight line. This behavior is described by Newton’s law of cooling, where the rate of temperature change is proportional to the temperature difference: $$ \frac{dT}{dt}=-k(T-T_s) $$ so as $T$ gets closer to $T_s$, the magnitude of $\frac{dT}{dt}$ decreases, and the graph levels off toward an asymptote near the ambient temperature (it does not keep falling at the same rate).

2018-13C · Writtend3Waves and Thermal · Stopping distance and reaction time

(2018-13: Maintaining a Safe Braking Distance) This question is about maintaining a safe braking distance when driving.

Consider a car driving along a straight road at 45 miles per hour (mph). The driver brakes and decelerates at $3 \mathrm{~m/s}^{2}$ until the car comes to rest.

Consider a second car driving behind the first car at the same speed. When the first car brakes, the driver of the second car takes 1.2 seconds to react before braking with the same deceleration of $3 \mathrm{~m/s}^{2}$. The second car also comes to rest.

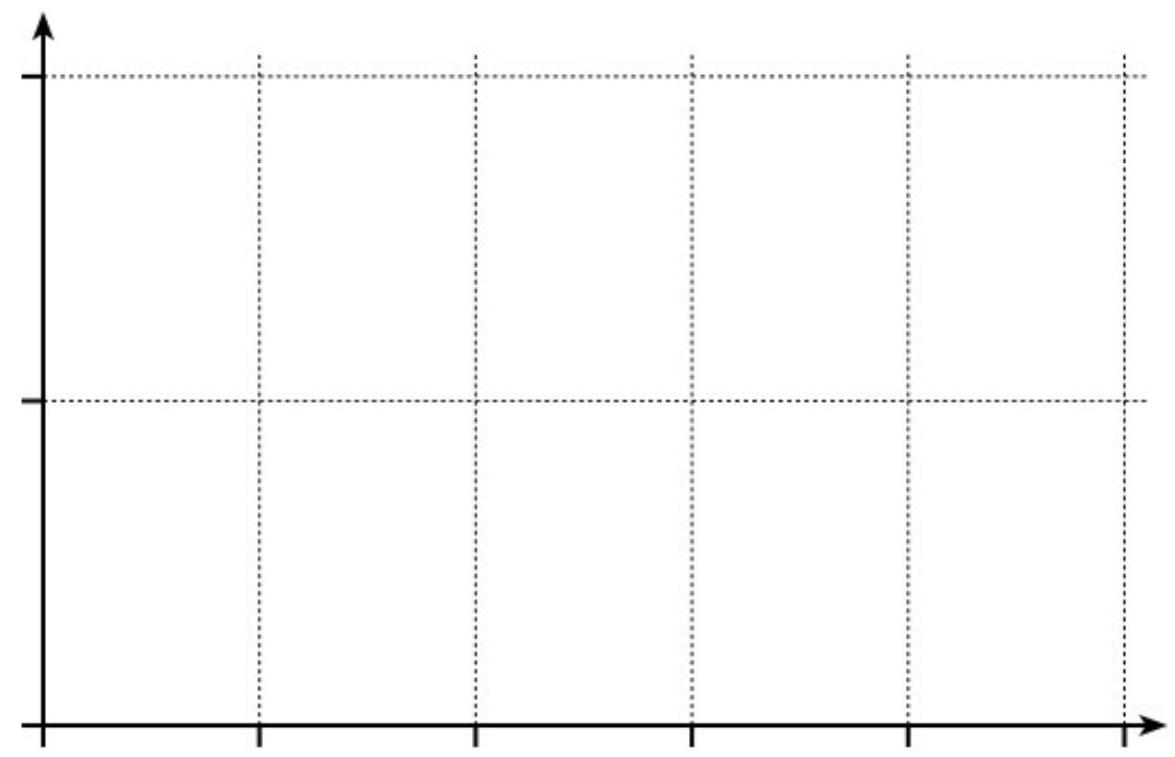
(a) 1 mile = 1.6 km. Show that $45 \text{ mph} = 20 \text{ m/s}$. (b) Using the axes below, draw a velocity-time graph for each car.

Assume $t = 0$ at the moment when the first car starts to brake. Add an appropriate scale to each axis and label the graphs to show which line corresponds to which car.

figure
(c) State the minimum distance necessary between the two cars, before the first car brakes, to avoid a collision.

On some roads chevrons ($>$) are used to encourage drivers to keep a safe distance. Keeping at least 2 chevrons visible, as shown on the road sign, between your car and the car in front ensures that there is a safe braking distance between the cars.

(d) The chevrons in the photograph are 30 m apart. A driver takes 1.2 seconds to react before braking with a deceleration of $3 \mathrm{~m/s}^{2}$. At what speed would using the chevrons no longer provide a safe braking distance?

An alternative way to ensure a safe braking distance between two cars is to time 2 seconds between the car in front passing a stationary roadside object (such as a tree) and the following car passing the same object. This is easily accomplished by saying the rhyme:

"Only a fool breaks the two second rule" ... which takes about 2 seconds to say.

(e) Explain why the "only a fool breaks the two second rule" method will maintain a safe braking distance at any speed.
Show worked solution
(a)

Using $1\ \mathrm{mile}=1.6\ \mathrm{km}=1600\ \mathrm{m}$ and $1\ \mathrm{hour}=3600\ \mathrm{s}$, the speed is $$ 45\ \mathrm{mph}=45\times \frac{1600\ \mathrm{m}}{3600\ \mathrm{s}}=45\times \frac{4}{9}\ \mathrm{m\,s^{-1}}=20\ \mathrm{m\,s^{-1}} $$ So $45\ \mathrm{mph}=20\ \mathrm{m\,s^{-1}}$ as required.

(b)

Both velocity--time graphs start at $v=20\ \mathrm{m\,s^{-1}}$ when $t=0$. The first car immediately decelerates at $3\ \mathrm{m\,s^{-2}}$, so its graph is a straight line with gradient $-3\ \mathrm{m\,s^{-2}}$ from $(t,v)=(0,20)$ to where it reaches rest at $$ 0=20-3t \ \Rightarrow\ t=\frac{20}{3}\approx 6.7\ \mathrm{s} $$ After $t\approx 6.7\ \mathrm{s}$ the first car’s line stays on $v=0$. The second car continues at constant speed for the $1.2\ \mathrm{s}$ reaction time, so its graph is a horizontal line from $(0,20)$ to $(1.2,20)$, then it decelerates with the same gradient $-3\ \mathrm{m\,s^{-2}}$ until it reaches rest after a further $\frac{20}{3}\ \mathrm{s}$, at total time $t=1.2+\frac{20}{3}\approx 7.9\ \mathrm{s}$, then it also stays at $v=0$. A suitable scale is $t$ from $0$ to $8\ \mathrm{s}$ on the horizontal axis and $v$ from $0$ to $20\ \mathrm{m\,s^{-1}}$ on the vertical axis, with the earlier sloping line labelled “first car” and the delayed horizontal-then-sloping line labelled “second car”.

(c)

Because both cars brake with the same deceleration, once the second car starts braking they have the same acceleration, so the extra distance the second car needs (compared with the first) is the distance it travels during the reaction time. That distance is $$ d_{\mathrm{reaction}}=vt=(20)(1.2)=24\ \mathrm{m} $$ Therefore the minimum initial separation to avoid collision is $24\ \mathrm{m}$.

(d)

Keeping at least $2$ chevrons visible means the separation is at least $2\times 30=60\ \mathrm{m}$. As in part (c), the minimum separation required is the reaction distance $d=vt_r$, so chevrons cease to be safe when $vt_r=60\ \mathrm{m}$ with $t_r=1.2\ \mathrm{s}$: $$ v=\frac{60}{1.2}=50\ \mathrm{m\,s^{-1}} $$ So above $50\ \mathrm{m\,s^{-1}}$ (about $112.5\ \mathrm{mph}$) the chevrons would no longer provide a safe braking distance for these conditions.

(e)

The two-second rule keeps a fixed time gap of $2\ \mathrm{s}$, so the following distance is $d=v(2)$ and automatically increases in direct proportion to speed. The minimum safe distance needed to avoid hitting a braking car ahead (when both can brake similarly) is mainly set by reaction distance $d_{\min}=v t_r$, which is also proportional to $v$. Since $2\ \mathrm{s}$ is longer than typical reaction times (here $1.2\ \mathrm{s}$), keeping a $2\ \mathrm{s}$ time headway provides at least the required reaction distance at any speed, and the distance grows appropriately as speed increases.

2019-11B · Writtend3Waves and Thermal · Electromagnetic force — DC motor

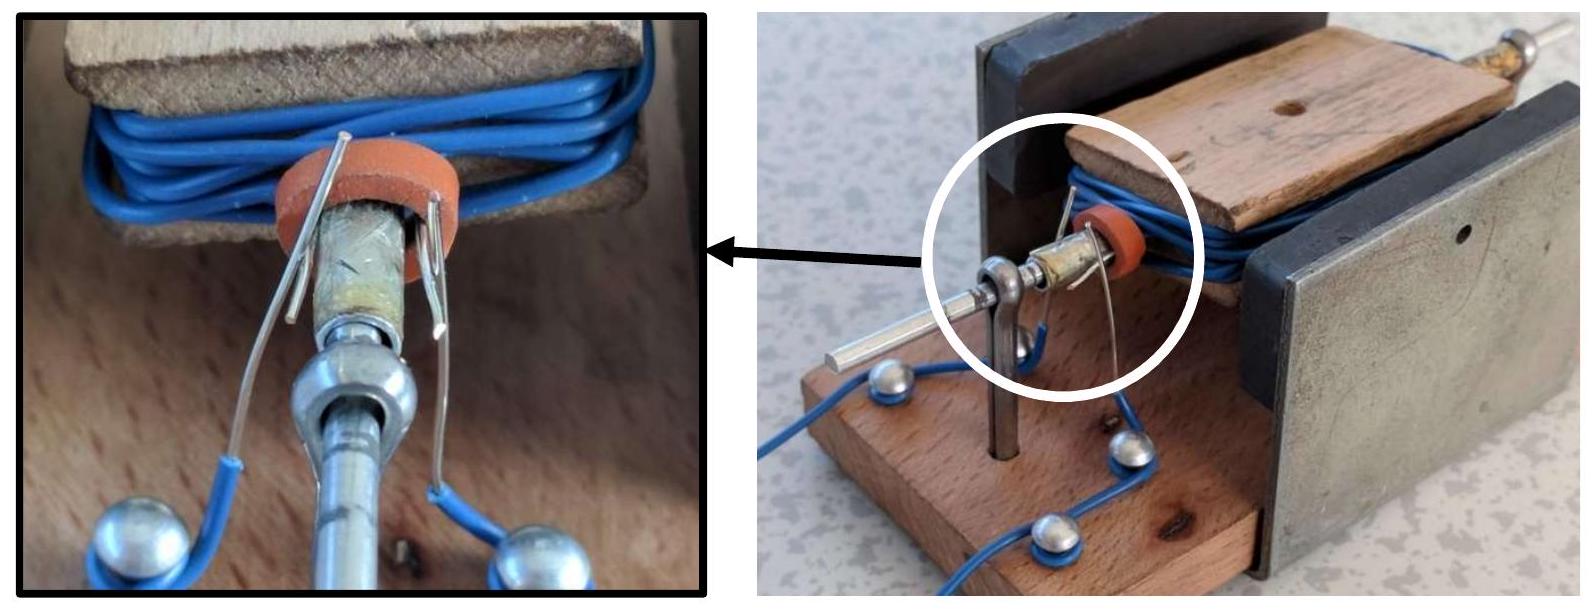
(2019-11) The photographs show a simple demonstration d.c. electric motor that is used to illustrate how an electric motor works.

figure

Explain the basic principles of a d.c. electric motor
You may annotate the photograph
[0pt]

Show worked solution
Basic principle: force on a current-carrying conductor in a magnetic field

A d.c. motor works because a conductor carrying current in a magnetic field experiences a force. In the photograph, the permanent magnets provide a magnetic field $B$ across the gap, and the rectangular coil (armature) carries a current $I$ from the d.c. supply. The direction of the force on each side of the coil is given by Fleming's left-hand rule (or by the motor effect): $F = BIL$ where $L$ is the length of wire in the field. The two long sides of the coil carry current in opposite directions, so the forces on them are in opposite directions.

Turning effect (torque) on the coil

Because the forces act on opposite sides of the coil and are separated by a distance, they form a couple. One side is pushed up while the other is pushed down (depending on current direction), producing a turning moment that makes the coil rotate. As the coil turns, the forces continue to produce rotation rather than linear motion because they act tangentially around the axle/pivot.

Role of the split-ring commutator and brushes

To keep the coil turning in the same direction, the current in the coil must reverse every half-turn so that the forces on the two sides continue to produce a couple in the same rotational sense. In the photograph, this is done by a split-ring commutator: each half of the ring is connected to one end of the coil, and carbon/metal brushes press on the ring to supply current. After half a rotation, the split-ring swaps which brush contacts which end of the coil, reversing the current in the coil automatically.

Continuous rotation and factors affecting speed

With the current reversing each half-turn, the torque keeps acting in the same direction, so the coil continues to rotate. Increasing $B$ (stronger magnets), increasing $I$ (higher supply voltage or lower resistance), or increasing the effective length/area of wire in the field increases the turning effect, so the motor runs more strongly and can reach a higher speed under load.

Suggested annotation of the photograph

Label the permanent magnets as providing magnetic field $B$ across the air gap, label the coil as carrying current $I$, add arrows on opposite sides of the coil for opposite current directions, add force arrows on those sides showing opposite forces (from Fleming’s left-hand rule), label the split-ring commutator and brushes showing the current reversal every half-turn, and add a curved arrow showing the direction of rotation produced by the couple.

2020-13C · Writtend3Waves and Thermal · Power, energy, and range estimation

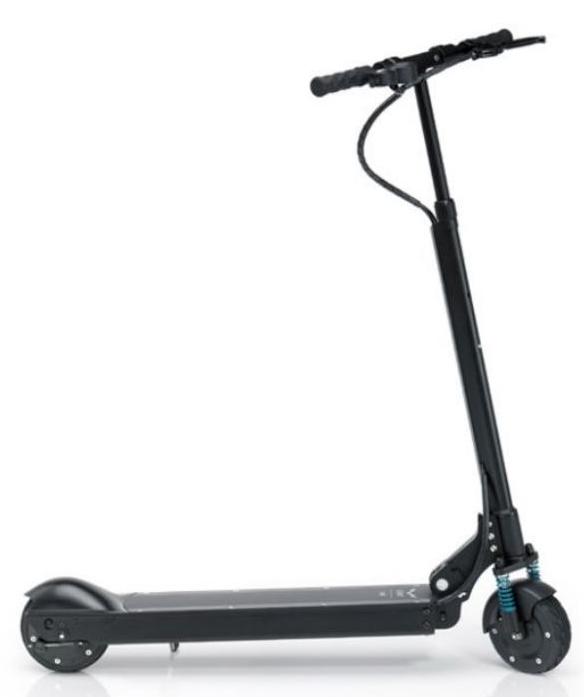
(2020-13) Electric scooters are a popular means of urban transport in some cities.

A typical electric scooter has the following specifications:

  • Battery capacity $=300 \mathrm{~Wh}$ (watt hours)
  • Maximum power output $=400 \mathrm{~W}$
  • Mass $=12.5 \mathrm{~kg}$
  • Maximum range $=30 \mathrm{~km}$
    figure

The scooter's electric motor does mechanical work to overcome the drag force (due to rolling friction with the road and air resistance) and to increase the kinetic energy of the scooter and rider.
(a) By considering the equation for Work Done, show that:

$$ \text { Power }=\text { Resultant Force } \times \text { velocity } $$

(b) (i) Using the motor at maximum power, a scooter rider records the maximum possible steady speed as $7 \mathrm{~m} / \mathrm{s}$.

Use the data given and the answer to part (a) to show that the drag force acting on the scooter and rider is about 60 N .
(b) (ii) The battery capacity is given in units of watt hours (Wh).

1 Wh is a power of 1 watt for 1 hour.
Calculate the energy, in joules, stored in the scooter battery
(b) (iii) The manufacturer claims that the maximum range of the scooter (on one full charge of the battery) is 30 km .
Using the values calculated previously and the specifications of the scooter, determine the range of the scooter when travelling at $7 \mathrm{~m} / \mathrm{s}$.
(b) (iv) The drag force acting on the scooter and rider increases with speed.

Without further calculation, explain whether or not the range of the scooter depends on the speed.

Hence assess the manufacturer's claim that the maximum range is 30 km .
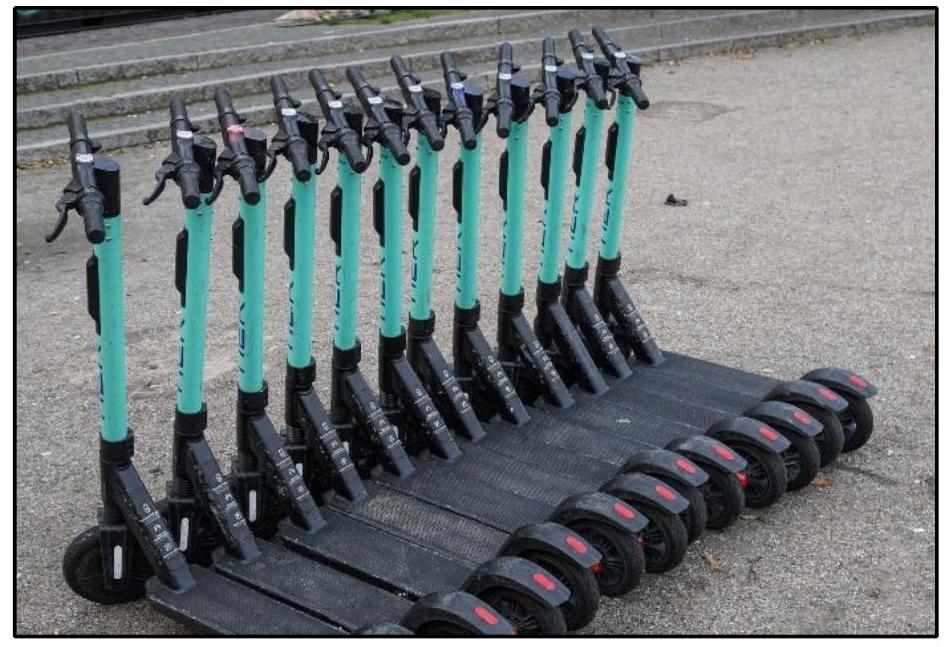
Scooters are available to hire in some cities.

To extend the range of the scooter through the day, a hire company plans to add a solar panel to the area of the scooter where the rider stands.

figure

(c) (i) Estimate the area of a solar panel that could realistically be fitted to the foot plate of a typical scooter.
(c) (ii) A typical solar panel is $15 \%$ efficient.

On a sunny day, the intensity of sunlight at ground level is about $1.2 \mathrm{~kW} / \mathrm{m}^{2}$.
Estimate the amount of energy supplied to the scooter's battery by the solar panel during a typical day.

State any assumptions necessary and show your working.
Comment on the effectiveness of adding a solar panel to extend the range.

Show worked solution
(a)

Work done by a constant resultant force $F$ acting along the direction of motion over a distance $s$ is $W = Fs$. Power is the rate of doing work, so $P = \dfrac{W}{t}$. Substituting $W=Fs$ gives $$ P=\frac{Fs}{t}=F\left(\frac{s}{t}\right) $$ Since $\dfrac{s}{t}=v$ (speed), it follows that $$ P = Fv $$ so $\text{Power}=\text{Resultant Force}\times \text{velocity}$.

(b)(i)

At the maximum possible steady speed, the scooter’s kinetic energy is not increasing, so acceleration is zero and the resultant force is zero. Therefore the driving force from the motor balances the drag force, so the drag force equals the motor’s forward force. Using the result from part (a), $P=Fv$, with $P=400\,\mathrm{W}$ and $v=7\,\mathrm{m\,s^{-1}}$: $$ F=\frac{P}{v}=\frac{400}{7}\approx 57\,\mathrm{N}\approx 60\,\mathrm{N} $$ So the drag force is about $60\,\mathrm{N}$.

(b)(ii)

A battery capacity of $300\,\mathrm{Wh}$ means $300\,\mathrm{W}$ supplied for $1\,\mathrm{h}$. Since $1\,\mathrm{h}=3600\,\mathrm{s}$, $$ E = 300\,\mathrm{Wh} = 300\times 3600\,\mathrm{J} = 1.08\times 10^{6}\,\mathrm{J} $$ So the energy stored is $1.08\times 10^{6}\,\mathrm{J}$.

(b)(iii)

Travelling steadily at $7\,\mathrm{m\,s^{-1}}$ using maximum motor power means the battery is supplying power at about $400\,\mathrm{W}$. The operating time on one full charge is $$ t=\frac{E}{P}=\frac{1.08\times 10^{6}}{400}=2.70\times 10^{3}\,\mathrm{s} $$ The range is then $$ d=vt=7\times 2.70\times 10^{3}=1.89\times 10^{4}\,\mathrm{m}=18.9\,\mathrm{km}\approx 19\,\mathrm{km} $$ So at $7\,\mathrm{m\,s^{-1}}$ the range is about $19\,\mathrm{km}$.

(b)(iv)

Because the drag force increases with speed, the power needed to maintain a steady speed also increases since $P=Fv$. That means the battery energy is used up faster at higher speeds, so the range decreases as speed increases. Therefore the range does depend on speed, and a quoted maximum range of $30\,\mathrm{km}$ is only achievable at a lower speed than $7\,\mathrm{m\,s^{-1}}$ (and likely under favorable conditions such as smooth level ground and minimal wind); at $7\,\mathrm{m\,s^{-1}}$ the calculation gives only about $19\,\mathrm{km}$, so the claim is not valid for that high-speed travel.

(c)(i)

A realistic foot plate might be roughly $0.50\,\mathrm{m}$ long and $0.20\,\mathrm{m}$ wide, giving an available panel area of about $$ A \approx 0.50\times 0.20 = 0.10\,\mathrm{m^2} $$ So a reasonable estimate is $A\approx 0.1\,\mathrm{m^2}$.

(c)(ii)

With sunlight intensity $I=1.2\,\mathrm{kW\,m^{-2}}=1200\,\mathrm{W\,m^{-2}}$ and efficiency $\eta=0.15$, the electrical power from a panel of area $A\approx 0.10\,\mathrm{m^2}$ is $$ P_{\text{solar}}=\eta IA = 0.15\times 1200\times 0.10 \approx 18\,\mathrm{W} $$ Assuming the scooter spends about $6\,\mathrm{h}$ in strong sunshine during a typical sunny day (and the panel is uncovered and charging throughout), the energy supplied is $$ E_{\text{solar}} = P_{\text{solar}}t = 18\times 6\,\mathrm{Wh}=108\,\mathrm{Wh}=108\times 3600\,\mathrm{J}\approx 3.9\times 10^{5}\,\mathrm{J} $$ This is about $\dfrac{108}{300}\approx 0.36$ of the battery capacity, so in ideal conditions it could add a noticeable fraction of a charge over a day, but in practice the gain would be smaller because of shading by the rider’s feet, imperfect orientation, clouds, and charging losses; therefore adding a panel on the foot plate would only modestly extend the range rather than dramatically increase it.

2022-12B · Writtend3Waves and Thermal · Voltmeter loading effect on a circuit

(2022-12) An ideal voltmeter has an "infinite" resistance.
In reality, voltmeters do not have an infinite resistance but they do have a very high resistance, often significantly greater than $1 \mathrm{M} \Omega$.

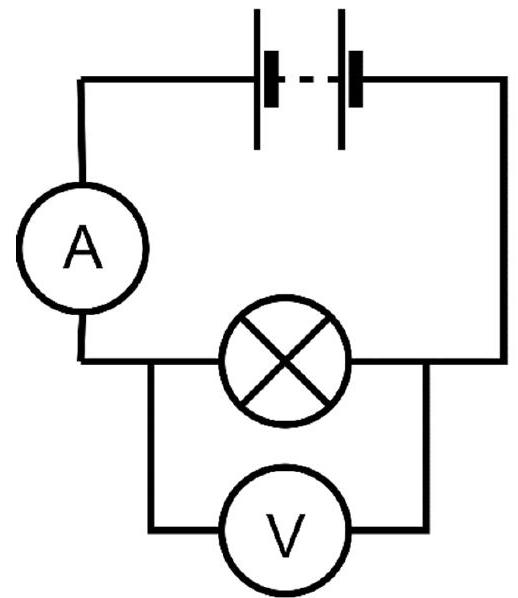
The circuit shows a bulb in series with a power supply and an ammeter, both of which have negligible resistance.

Explain why an ideal voltmeter should have an infinite resistance.

figure

For the circuit shown, state and explain how using a voltmeter with a resistance of $1 \mathrm{M} \Omega$ instead of an ideal voltmeter would affect the:
a) Current measured in the circuit by the ammeter
b) Potential difference measured across the bulb by the voltmeter
c) Resistance of the bulb calculated using the relationship $R=V / I$

Show worked solution
Why an ideal voltmeter should have infinite resistance

A voltmeter is connected in parallel with the component whose potential difference (p.d.) it measures, so if the voltmeter had a finite resistance it would take a current and change the currents and resistances in the circuit; an ideal voltmeter must therefore have infinite resistance so that the current through it is $I_V=V/R_V=0$, meaning it does not affect the circuit and measures the true p.d. across the component.

(a)

Using a $1\,\mathrm{M}\Omega$ voltmeter increases the current measured by the ammeter because the voltmeter is in parallel with the bulb, so it provides an additional path for charge; this makes the equivalent resistance of the bulb–voltmeter combination smaller than the bulb’s resistance alone, so the total circuit resistance decreases and the supply delivers a larger total current (the ammeter reads this total current, which is the sum of the bulb current and the voltmeter current).

(b)

The p.d. measured across the bulb is essentially unchanged because the voltmeter is connected directly across the bulb, so it measures the p.d. across the parallel combination; with a power supply of negligible resistance, the terminal p.d. across the external circuit remains (approximately) constant even if the total current changes, so the bulb’s p.d. (and hence the voltmeter reading) stays the same, or at most would be very slightly smaller only if there were any non-negligible internal resistance in the supply.

(c)

The resistance calculated using $R=V/I$ would be smaller than the true resistance of the bulb because the current $I$ from the ammeter is the total current drawn by the parallel combination, not just the current through the bulb; therefore $R=V/I$ gives the equivalent resistance of the bulb in parallel with the voltmeter: $$ \frac{1}{R_{\mathrm{eq}}}=\frac{1}{R_{\mathrm{bulb}}}+\frac{1}{R_V} $$ so $R_{\mathrm{eq}}

2023-11B · Writtend2Waves and Thermal · Heat transfer mechanisms

(2023-11) It is very important to insulate buildings to make them as energy efficient as possible.

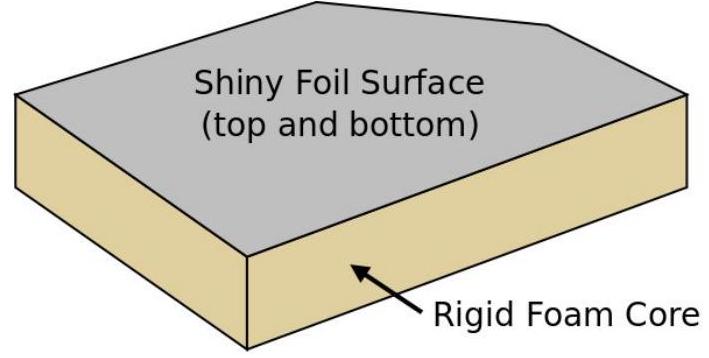
One particular type of insulation comprises a thick solid foam core with shiny foil bonded to each side.

Explain how using this form of insulation reduces heat loss

figure

from buildings.

Show worked solution
Heat loss reduction using a thick foam core with shiny foil on each side Conduction The thick solid foam core is a poor thermal conductor because it contains many tiny pockets of trapped gas. Gas conducts heat poorly and, because it is trapped in small cells, it cannot circulate easily. This greatly reduces heat transfer by conduction through the insulation from the warm interior to the cooler exterior. Convection Convection requires a fluid (air) to move and form convection currents. In the foam, the air is trapped in closed cells so it cannot move freely, so convection currents cannot form inside the insulation. This further reduces heat loss through the material. Radiation The shiny foil surfaces have low emissivity and are good reflectors of infrared radiation. The warm interior surfaces emit thermal radiation; the foil reflects a large fraction of this radiation back into the building, reducing radiative heat loss. Similarly, on the colder side, the foil surface emits relatively little infrared radiation to the surroundings, so radiation losses are reduced on both faces. Overall effect The foam core mainly reduces conduction and convection, while the shiny foil layers mainly reduce infrared radiation. Together, these mechanisms significantly reduce the total rate of heat transfer from the building.
2023-14C · Writtend4Waves and Thermal · Kepler's third law and parallax

(2023-14: Scale of the Solar System) Note: In this question all of the diagrams are not to scale. The planets and the sun are very small compared to the distances between them.

In 1619 Johannes Kepler published his $3^{\text {rd }}$ Law of planetary motion. The $3^{\text {rd }}$ Law stated that the square of the orbital period of a planet is proportional to the cube of the mean orbital radius around the Sun. This is written as:

$$ T^{2} \propto R^{3} \quad T=\text { period of orbit } \quad R=\text { mean radius of orbit } $$

The mean orbital radius of the Earth is defined as 1 Astronomical Unit (1 AU) i.e. the distance between the Earth and the Sun is 1 AU .
a) The orbital period of Venus is 225 days.

Calculate the mean orbital radius of Venus in astronomical units.
Kepler's Laws allowed early astronomers to find the relative positions of the planets in the solar system but finding the actual (absolute) distances was more challenging.

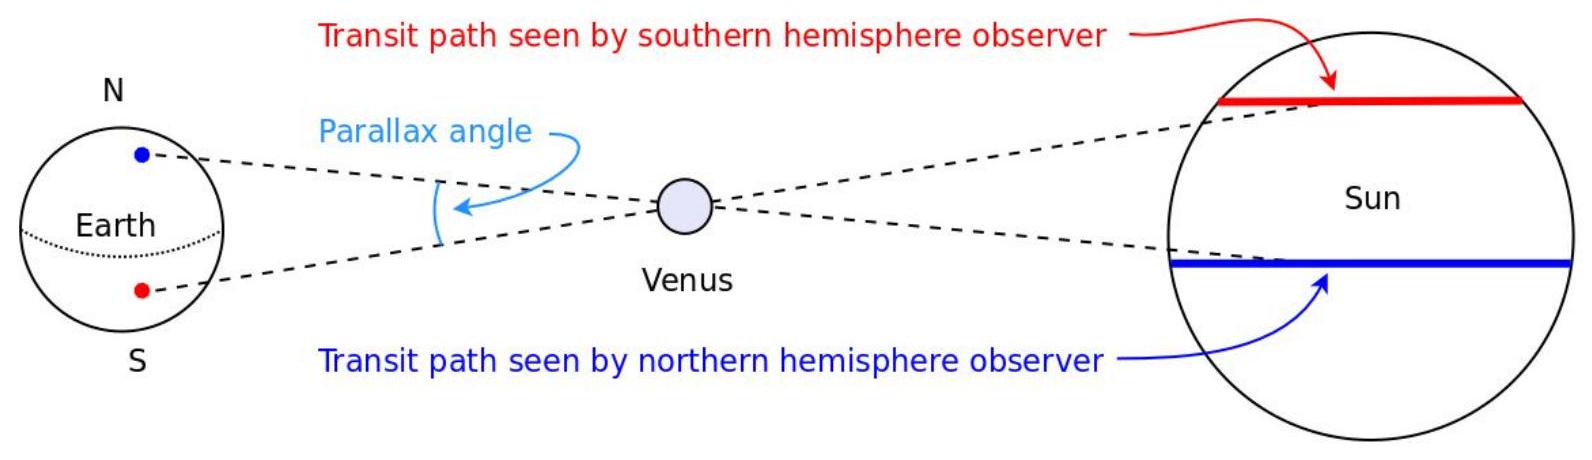
Edmund Halley (1656-1742) suggested observing the transit of Venus across the Sun from different locations on Earth would allow the absolute scale of the solar system to be determined. Two different observers on opposite sides of the planet would see Venus follow slightly different paths across the face of the sun. The apparent difference in position that comes from viewing an object from two different points is called parallax. Accurately measuring the different transit times would allow the parallax angle to be determined.

figure

NOT to scale
G RESEARCH

In 1768, Captain James Cook sailed to the island of Tahiti in the southern hemisphere to observe the 1769 transit of Venus.
b) Explain the advantage of making observations simultaneously from the northern and southern hemispheres rather than two different locations in the UK.
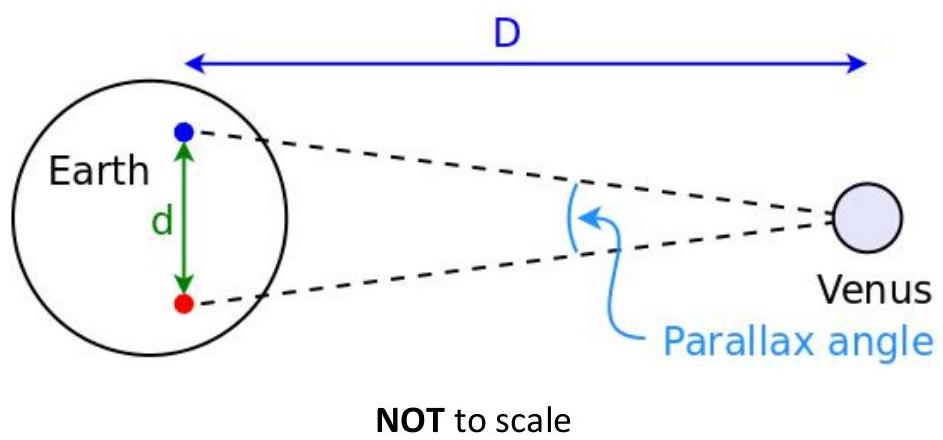
From two different locations separated by a distance of $d=9560 \mathrm{~km}$, the parallax angle was determined to be $0.0130^{\circ}$.

figure

Note: $d=9560 \mathrm{~km}$ is the straight line distance between the two observation locations, not the distance covered by travelling along the curve of the Earth's surface.
c) Use these values to calculate the distance between the Earth and Venus
d) Hence show that the corresponding value for 1 AU is approximately 150 million km
e) Using the information provided earlier in the question, calculate the orbital speed of Venus
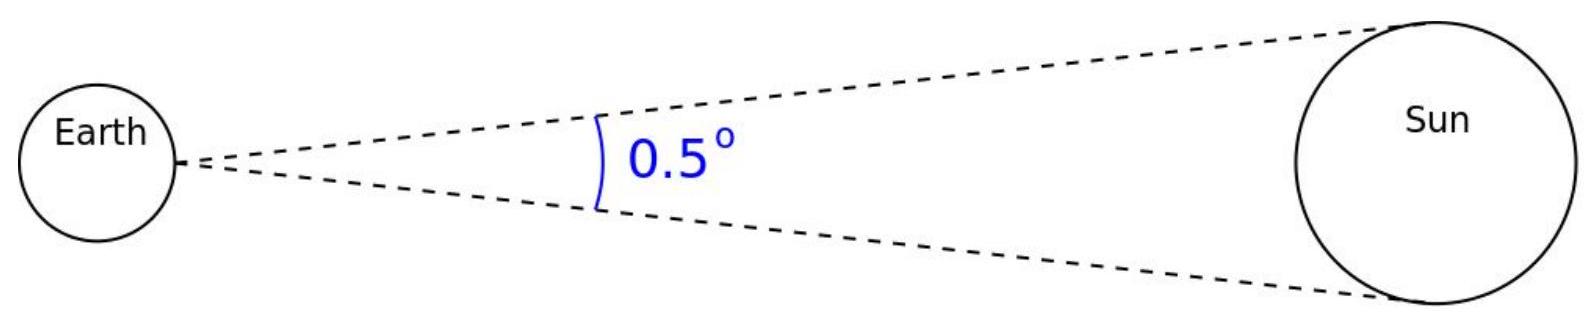
Observed from Earth, the angular size of the sun is approximately $0.5^{\circ}$ as shown.

figure

NOT to scale
f) Ignoring the motion of Earth through space, show that the transit of Venus observed by Captain Cook and countless other astronomers last for several hours.

Show worked solution
(a)

Kepler's $3^{\mathrm{rd}}$ law gives $T^2\propto R^3$, so for two planets orbiting the Sun $$ \left(\frac{T_V}{T_E}\right)^2=\left(\frac{R_V}{R_E}\right)^3 $$ With Earth as the reference, $T_E=365$ days and $R_E=1$ AU, and for Venus $T_V=225$ days: $$ R_V=\left(\frac{T_V}{T_E}\right)^{2/3}R_E=\left(\frac{225}{365}\right)^{2/3}(1\ \mathrm{AU}) $$ $$ R_V\approx (0.616)^{2/3}\ \mathrm{AU}\approx 0.72\ \mathrm{AU} $$ So the mean orbital radius of Venus is approximately $0.72$ AU.

(b)

Parallax depends on the separation (baseline) between observers: a larger baseline produces a larger parallax angle and therefore a larger, more measurable difference in the observed path and transit timing of Venus across the Sun. Observations from the northern and southern hemispheres can be separated by a distance comparable to the Earth’s diameter, whereas two sites in the UK are much closer together, giving a much smaller parallax angle and much larger percentage uncertainty; additionally, observing from widely separated hemispheres reduces the chance that poor weather at one region prevents the measurement.

(c)

The two observers are separated by a straight-line baseline $d=9560$ km and measure a parallax angle $p=0.0130^\circ$. For a distant object and a small angle, the geometry gives (small-angle approximation) $$ p\ (\mathrm{radians})\approx \frac{d}{D} $$ where $D$ is the distance from Earth to Venus. First convert $p$ to radians: $$ p=0.0130^\circ\times\frac{\pi}{180}\approx 2.27\times 10^{-4}\ \mathrm{rad} $$ Then $$ D\approx \frac{d}{p}=\frac{9560}{2.27\times 10^{-4}}\ \mathrm{km}\approx 4.22\times 10^{7}\ \mathrm{km} $$ So the Earth--Venus distance is approximately $4.2\times 10^7$ km (about $42$ million km).

(d)

At transit Venus is between Earth and the Sun, so the Earth--Venus distance is the difference of their orbital radii: $$ D_{EV}=(1-0.72)\ \mathrm{AU}\approx 0.28\ \mathrm{AU} $$ Using the more precise value from (a), $R_V\approx 0.723$ AU, so $$ D_{EV}=(1-0.723)\ \mathrm{AU}=0.277\ \mathrm{AU} $$ From (c), $0.277$ AU corresponds to $4.22\times 10^7$ km, hence $$ 1\ \mathrm{AU}\approx \frac{4.22\times 10^7\ \mathrm{km}}{0.277}\approx 1.52\times 10^8\ \mathrm{km}\approx 1.5\times 10^8\ \mathrm{km} $$ Therefore $1$ AU is approximately $150$ million km, as required.

(e)

The orbital speed is the circumference of the orbit divided by the period: $v=\dfrac{2\pi R}{T}$. Use $R_V\approx 0.723\ \mathrm{AU}\approx 0.723\times(1.5\times 10^8)\ \mathrm{km}\approx 1.08\times 10^8\ \mathrm{km}$ and $T_V=225$ days $=225\times 86400\ \mathrm{s}=1.944\times 10^7\ \mathrm{s}$. Then $$ v=\frac{2\pi(1.08\times 10^8\ \mathrm{km})}{1.944\times 10^7\ \mathrm{s}}\approx 34.9\ \mathrm{km\,s^{-1}} $$ So the orbital speed of Venus is approximately $35\ \mathrm{km\,s^{-1}}$.

(f)

During a transit, Venus moves across the Sun’s disc, whose angular diameter as seen from Earth is about $0.5^\circ$. Ignoring Earth’s motion through space, the apparent angular speed of Venus across the sky can be estimated from its tangential speed and its distance from Earth: $$ \omega \approx \frac{v}{D_{EV}} $$ Using $v\approx 35\ \mathrm{km\,s^{-1}}$ from (e) and $D_{EV}\approx 4.22\times 10^7$ km from (c): $$ \omega \approx \frac{35}{4.22\times 10^7}\ \mathrm{s^{-1}}=8.3\times 10^{-7}\ \mathrm{rad\,s^{-1}} $$ Convert to degrees per second using $1\ \mathrm{rad}=57.3^\circ$: $$ \omega \approx (8.3\times 10^{-7})(57.3)\ \mathrm{deg\,s^{-1}}\approx 4.8\times 10^{-5}\ \mathrm{deg\,s^{-1}} $$ The time to move an angular distance comparable to the Sun’s diameter is then $$ t\approx \frac{0.5^\circ}{4.8\times 10^{-5}\ \mathrm{deg\,s^{-1}}}\approx 1.0\times 10^4\ \mathrm{s}\approx 2.9\ \mathrm{h} $$ This is of order a few hours, so the transit naturally lasts several hours (and can be longer depending on the exact chord Venus traces across the Sun).

2024-11B · Writtend2Waves and Thermal · Dispersion by a prism

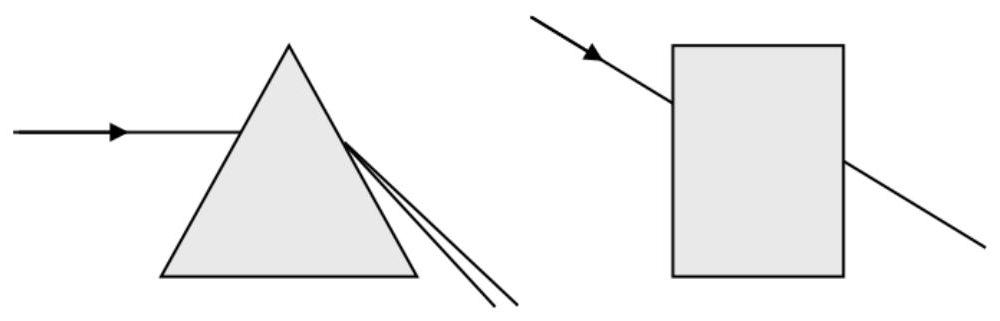
(2024-11) A raybox can be used to demonstrate refraction in a rectangular glass block and dispersion in a triangular glass prism.

In both cases the incident ray is a narrow light ray of white light which is incident on the glass air boundary at an angle of $30^{\circ}$ to the normal line.

figure

Explain why:

  • In the prism, the light emerging is diverging and forms a spectrum of different colours
  • Whereas in the rectangular glass block the light emerges as a narrow light ray of white light which does not form a spectrum of different colours

Show worked solution
(a) Prism: diverging light and spectrum formation

White light contains a range of wavelengths (colours). In glass, the refractive index depends on wavelength, so different colours travel at different speeds and refract by different amounts; this is dispersion. When the incident white ray enters the prism at $30^{\circ}$ to the normal, each colour is refracted into a slightly different direction because each colour has a different refractive index $n(\lambda)$, so by Snell's law each colour has a different refracted angle $r(\lambda)$: $$ n_{\text{air}}\sin i=n_{\text{glass}}(\lambda)\sin r(\lambda) $$ where $i=30^{\circ}$ and $n_{\text{air}}\approx1$. Since typically $n_{\text{glass}}(\text{violet})>n_{\text{glass}}(\text{red})$, violet light bends more towards the normal on entry (smaller $r$) and red bends less (larger $r$), so the beam is already slightly spread inside the prism. At the second face, the rays meet another boundary at a different orientation (the prism faces are not parallel), so each colour refracts again by a different amount and, crucially, the second refraction does not cancel the first; instead, it increases the angular separation between colours. The prism geometry therefore produces both a net deviation of the beam and a separation of colours into different exit directions, so the emerging light is diverging and forms a spectrum.

Rectangular glass block: emergent narrow white ray with no spectrum

In a rectangular glass block, the entry and exit faces are parallel. The incident ray at $30^{\circ}$ refracts on entry; again, each colour has a slightly different refracted angle inside the glass due to dispersion, so there is a small tendency to separate. However, when the rays reach the second face, the normal there is parallel to the first normal, and because the faces are parallel the ray meets the second surface with the same internal angle it had after the first refraction. Applying Snell's law at the exit surface for each colour gives an emergent angle that is the same as the original incident angle (in direction), so the second refraction cancels the angular dispersion produced at the first surface: $$ n_{\text{glass}}(\lambda)\sin r(\lambda)=n_{\text{air}}\sin e(\lambda) $$ combining with the entry relation yields $\sin e(\lambda)=\sin i$, so $e(\lambda)=i=30^{\circ}$ for all colours (same emergent direction). Therefore, although different colours may take slightly different paths inside the block, they leave in the same direction and recombine into a single narrow ray of white light. The beam may be laterally displaced (shifted sideways), but it is not angularly separated, so no spectrum is seen.

2025-11B · Writtend4Waves and Thermal · Specific heat capacity and latent heat from heating curve

(2025-11) A well insulated sample of material of mass $m$ is heated using an electric heater of power $P$. The sample is solid at $0^{\circ}\mathrm{C}$ and liquid at $100^{\circ}\mathrm{C}$. The graph shows temperature vs time as it is heated.

Using information from the graph, explain how the graph shows that:

  • the specific heat capacity of the material when it is a liquid is greater than the specific heat capacity of the material when it is a solid
  • the specific latent heat of fusion derived from the graph in units of J/kg is numerically greater than the specific heat capacity of the material as a liquid derived from the graph in units of J/(kg$^{\circ}$C)

Show worked solution
(a)

Because the heater delivers energy at a constant rate $P$, the energy transferred in time $\Delta t$ is $E=P\Delta t$; in any region where the sample is in a single phase (no melting/boiling), the temperature rise obeys $$ P\Delta t=mc\,\Delta T\quad\Rightarrow\quad\frac{\Delta T}{\Delta t}=\frac{P}{mc} $$ so the gradient of the $T$--$t$ graph in a single-phase region is $dT/dt=P/(mc)$ and hence $c$ is inversely proportional to the gradient; from the graph, the liquid-heating section (after melting, where $T$ rises from $0^{\circ}\mathrm{C}$ to $100^{\circ}\mathrm{C}$) is less steep than the solid-heating section (before melting), i.e. $(dT/dt)_{L}<(dT/dt)_{S}$; therefore $$ c_{L}=\frac{P}{m(dT/dt)_{L}}>\frac{P}{m(dT/dt)_{S}}=c_{S} $$ so the graph shows the specific heat capacity when liquid is greater than when solid.

(b)

During melting the graph shows a horizontal (constant-temperature) section at $0^{\circ}\mathrm{C}$, meaning energy is still being transferred but is not raising temperature; the energy transferred in this plateau is $E_{f}=P\Delta t_{f}$, where $\Delta t_{f}$ is the duration of the $0^{\circ}\mathrm{C}$ plateau read from the graph, so the specific latent heat of fusion is $$ L_{f}=\frac{E_{f}}{m}=\frac{P\Delta t_{f}}{m} $$

For the liquid region, the temperature rises from $0^{\circ}\mathrm{C}$ to $100^{\circ}\mathrm{C}$ over a time $\Delta t_{L}$ read from the graph, so using $P\Delta t_{L}=mc_{L}(100-0)$ gives $$ c_{L}=\frac{P\Delta t_{L}}{m(100)}=\frac{P}{m}\left(\frac{\Delta t_{L}}{100}\right) $$

Comparing the two expressions, both $L_{f}$ and $c_{L}$ are proportional to $P/m$, and the numerical comparison reduces to comparing the relevant times taken from the graph: $$ L_{f}>c_{L}\quad\Longleftrightarrow\quad\frac{P\Delta t_{f}}{m}>\frac{P}{m}\left(\frac{\Delta t_{L}}{100}\right)\quad\Longleftrightarrow\quad\Delta t_{f}>\frac{\Delta t_{L}}{100} $$

The graph shows that the melting plateau lasts much longer than the time it takes the liquid to warm by $1^{\circ}\mathrm{C}$ (which is $\Delta t_{L}/100$ since the liquid warms by $100^{\circ}\mathrm{C}$ in time $\Delta t_{L}$); therefore the energy per kilogram needed to melt the solid (the numerical value of $L_{f}$ in $\mathrm{J\,kg^{-1}}$) is greater than the energy per kilogram needed to raise the liquid by $1^{\circ}\mathrm{C}$ (the numerical value of $c_{L}$ in $\mathrm{J\,kg^{-1}\,^{\circ}C^{-1}}$), so the graph shows $L_{f}$ is numerically greater than $c_{L}$.

2025-14C · Writtend4Waves and Thermal · Standing waves on a string

(2025-14: Using a sonometer) A sonometer investigates vibration of a wire under tension. The frequency $f$ is measured as a function of tension $T$.

(a) Use data from the graph to show that $f^{2}$ is directly proportional to $T$ ($f^{2}\propto T$).

The frequency of vibration is: $$f^{2}=\frac{T}{4L^{2}\mu}$$

where: $f=$ frequency, $T=$ tension, $L=$ length, $\mu=$ mass per unit length.

(b) Given $L=110\ \mathrm{cm}$, use the graph to determine $\mu$. (c) The distance between bridges is reduced to 90 cm. Add a line to the graph labeled "part (c)". (d) A thicker wire of same material with twice the diameter is used for $L=110\ \mathrm{cm}$. Add a line labeled "part (d)". (e) Explain why a grand piano needs strings of different thicknesses and different lengths.
Show worked solution
(a)

From the graph, plotting $f^{2}$ vs $T$ gives a straight line through the origin, which confirms $f^{2}\propto T$. Alternatively, taking points: if $T$ doubles, $f^{2}$ also doubles; if $T$ triples, $f^{2}$ triples, etc. This linear relationship through the origin proves direct proportionality.

(b)

From the equation $f^{2}=T/(4L^{2}\mu)$, the gradient of the $f^{2}$ vs $T$ graph is $1/(4L^{2}\mu)$. Reading the gradient from the graph: slope $=m$ (determined by $\Delta f^{2}/\Delta T$ from the line).

With $L=110\ \mathrm{cm}=1.10\ \mathrm{m}$: $$ \mu=\frac{1}{4L^{2}m}=\frac{1}{4(1.10)^{2}m} $$

(Using actual graph data would give a numerical value for $\mu$ in $\mathrm{kg/m}$.)

(c)

For a shorter wire ($L=90\ \mathrm{cm}$), the equation becomes $f^{2}=T/(4\times0.90^{2}\mu)=T/(3.24\mu)$, which is steeper than the original $f^{2}=T/(4\times1.10^{2}\mu)=T/(4.84\mu)$. The new line has a larger slope (steeper) because $L$ appears in the denominator.

(d)

For a wire with twice the diameter, the cross-sectional area is 4 times larger, so $\mu$ (mass per unit length) is 4 times larger: $\mu^{\prime}=4\mu$. The equation becomes $f^{2}=T/(4L^{2}(4\mu))=T/(16L^{2}\mu)$, which has $1/4$ the slope of the original. The new line is shallower (less steep) than the original.

(e)

A piano needs to produce a wide range of frequencies (musical notes). From $f=\sqrt{T/(4L^{2}\mu)}$, the frequency depends on $L$ (length) and $\mu$ (thickness, since thicker wire has larger $\mu$). To achieve both low and high frequencies across the keyboard:

  • Different lengths: Lower notes require longer strings; higher notes require shorter strings
  • Different thicknesses: For a given length, a thicker string (larger $\mu$) produces a lower frequency, while a thinner string produces a higher frequency

By combining variations in both length and thickness, piano designers can achieve the required range of notes while maintaining practical string tensions and physical constraints. Using only one parameter would require impractical values (extremely long or very thick strings for low notes, or impractically short/thin strings for high notes).